
 Shayne Gostisbehere
| Position | Left Defense / Right Defense | Current Team | Carolina Hurricanes |
| Shoots | Left | Current Contract | 3 years ($3.2M CapHit) |
| Height | 5'11" | Expires | 2026-27 |
| Weight (lbs) | 183 | Expiry Age (Jun 30) | 34 |
| Age (DOB) | 33 (Apr 20, 1993) | Expiry Status | UFA |
| Drafted | 2012, Round 3, Overall 78 (PHI) |
| Date | Team | Transaction | |
|---|---|---|---|
| Oct 28, 2025 | Carolina Hurricanes | Activated from IR | |
| Oct 24, 2025 | Carolina Hurricanes | Placed on IR | |
| Jan 12, 2025 | Carolina Hurricanes | Activated from IR | |
| Jan 5, 2025 | Carolina Hurricanes | Placed on IR | |
| Jul 1, 2024 | Carolina Hurricanes | Signed 3 years @ $3.200M AAV starting in 2024-25 | |
| Jul 1, 2023 | Detroit Red Wings | Signed 1 year @ $4.125M AAV starting in 2023-24 | |
| Jun 9, 2017 | Philadelphia Flyers | Signed 6 years @ $4.500M AAV starting in 2017-18 | |
| May 26, 2014 | Philadelphia Flyers | Signed to an entry level contract. |
Player Card(s)
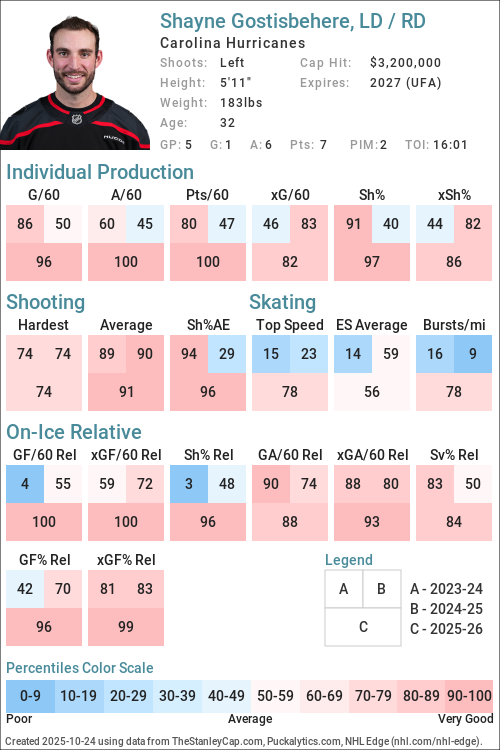
URL: https://thestanleycap.com/cdn/player_cards/20252026/shayne-gostisbehere-8476906.png
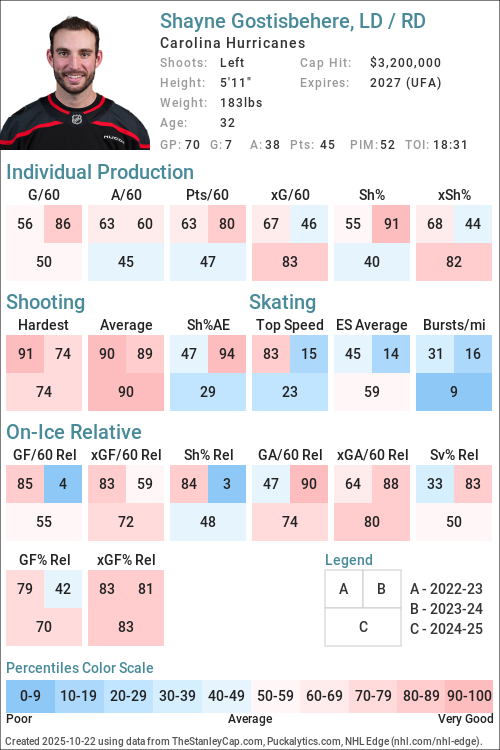
URL: https://thestanleycap.com/cdn/player_cards/20242025/shayne-gostisbehere-8476906.png
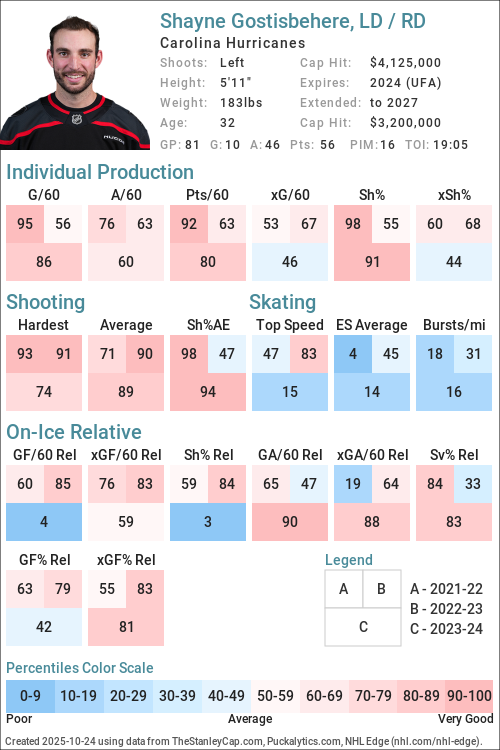
URL: https://thestanleycap.com/cdn/player_cards/20232024/shayne-gostisbehere-8476906.png
About Player Cards
Player cards present an infographic of a players performance using a series of Player Archetypes developed for Puckalytics.com and TheStanleyCap.com. The boxes in the rink image show the archetype ratings for the season specified in the card while the graphs to the right show the five-year trends for those archetypes.
Except for Faceoffs, the values shown are the players z-score (standard deviation from the mean) for the specific metric used to calculate the archetype values. When calculating z-scores forwards were compared to forwards and defensemen were compared to defensemen. Positive values indicate the player is above average and shaded in blue, while negative values indicate the player is below average and shaded in pink. The five year trend charts show a range of -4.0 to 4.0.
The value shown for Faceoffs is the faceoff winning percentage rather than their z-score with winning percentages below 50 in pink shades and above 50 in blue shades.
All archetypes are 5v5 except 5v4 TOI, 4v5 TOI, Skating (even strength) and Faceoffs (all situations). Archetypes use regular season data only.
Archetypes Summary
- Sniper - Measures the to score above the expected goal rate.
- Rebound - Measures the percent of a players shot attempts that come from rebounds (forwards only).
- 5v4 TOI - Powerplay ice time, calculated as the percentage of his teams 5v4 ice time that the player was on the ice for.
- Shooter - Measures whether a players points come from shots (goals or assists on rebounds from his shots).
- Producer - Measures a players ability to produce goals and assists, adjusted for quality of teammates.
- Playmaker - Measures whether a players points come from passes.
- Drive - Measures a players ability to drive puck possession and generate shot attempts for his team.
- Rush - Measures the percent of a players shot attempts that come from rush plays
- Possession - An indicator of a players ability to improve his teams puck possession game.
- Faceoffs - Faceoff Winning Percentage (min. 75 faceoffs taken).
- 5v5 TOI - The percentage of his teams 5v5 TOI that the player was on the ice for.
- Suppress - Measures a players ability to suppress opponent puck possession and shot attempts against.
- Skating - An indicator of a players skating ability, or speed bursts above 20mph per mile skated.
- Defend - An indicator of a players ability to suppress shot quality against.
- 4v5 TOI - Penalty Kill ice time, calculated as the percentage of his teams 4v5 ice time that the player was on the ice for.
Data Sources
- Salary data is from TheStanleyCap.com
- Skating data is from NHL Edge
- Other statistics are from Puckalytics.com and derived from data from NHL.com
Terms of Use
You are free to use include player cards in written articles, share on social media, or on other public websites under the following conditions:
- You credit TheStanleyCap.com as the source and provide a link back to TheStanleyCap.com or this player page.
- You do not mass copy/duplicate/publish dozens or hundreds of player cards. A few, or a handful for a written article is fine. Be reasonable. Fair use rules apply.
- If you are a high-traffic website you must download and host the image(s) on your site rather than overload TheStanleyCap servers with traffic.
Note: Player cards will update daily throughout the season so if you want to include snapshot then you must download the image.
If you have any questions, send an e-mail to the e-mail address at the top of this page.
Read Introducing Player Archetypes on HockeyAnalysis.com for more details on archetype calculations.
Core Archetypes
| Season | Team(s) | GP | TOI | Producer | Playmaker | Shooter | Sniper | Rebound | Rush | Skating | Defend |
|---|---|---|---|---|---|---|---|---|---|---|---|
| 2015-16 | PHI | 64 | 1.97 | 1.06 | 2.03 | 2.02 | - | -0.89 | - | 0.20 | |
| 2016-17 | PHI | 76 | -0.64 | -0.85 | -0.07 | -0.84 | - | 0.52 | - | -0.06 | |
| 2017-18 | PHI | 78 | 0.96 | 1.22 | -0.22 | -0.35 | - | -0.56 | - | 0.73 | |
| 2018-19 | PHI | 78 | 0.61 | 0.39 | 0.37 | -0.10 | - | 1.53 | - | -0.56 | |
| 2019-20 | PHI | 42 | -0.95 | -1.20 | 0.01 | 0.21 | - | -0.88 | - | 1.18 | |
| 2020-21 | PHI | 41 | -0.40 | -0.67 | 0.17 | 0.48 | - | 0.31 | - | -0.09 | |
| 2021-22 | ARI | 82 | 2.29 | 1.20 | 2.71 | 2.43 | - | -1.07 | -0.97 | 0.92 | |
| 2022-23 | ARI, CAR | 75 | 0.11 | 0.18 | -0.19 | -0.24 | - | 1.00 | -0.63 | -0.31 | |
| 2023-24 | DET | 81 | 1.12 | -0.02 | 2.30 | 1.55 | - | -1.10 | -0.99 | 1.03 | |
| 2024-25 | CAR | 70 | -0.46 | -0.70 | -0.07 | -0.44 | - | -0.68 | -1.15 | 0.03 | |
| 2025-26 | CAR | 55 | 3.34 | 2.96 | 1.69 | 0.64 | - | 0.24 | -0.87 | -1.29 |
Situational and Secondary Archetypes
| Season | Team(s) | GP | TOI | 5v5 TOI | 5v4 TOI | 4v5 TOI | Possession | Drive | Suppress | Faceoffs |
|---|---|---|---|---|---|---|---|---|---|---|
| 2015-16 | PHI | 64 | -0.52 | 1.54 | -2.40 | -0.19 | -0.32 | 0.03 | - | |
| 2016-17 | PHI | 76 | -0.85 | 1.59 | -2.22 | 0.46 | 1.51 | -0.80 | - | |
| 2017-18 | PHI | 78 | 0.19 | 1.55 | -2.18 | 1.02 | 0.29 | 1.27 | - | |
| 2018-19 | PHI | 78 | -0.61 | 1.51 | -2.16 | 0.96 | 0.59 | 0.83 | - | |
| 2019-20 | PHI | 42 | -0.69 | 0.50 | -2.20 | 0.61 | -0.02 | 0.89 | - | |
| 2020-21 | PHI | 41 | 0.01 | 0.76 | -2.19 | -0.14 | 0.10 | -0.27 | - | |
| 2021-22 | ARI | 82 | 0.45 | 1.48 | -1.20 | -0.37 | 0.04 | -0.77 | - | |
| 2022-23 | ARI, CAR | 75 | 0.28 | 0.92 | -1.55 | 1.09 | 0.99 | 0.62 | - | |
| 2023-24 | DET | 81 | -0.86 | 1.23 | -1.78 | 0.74 | -0.04 | 1.25 | - | |
| 2024-25 | CAR | 70 | -1.12 | 1.48 | -1.86 | 1.03 | 0.40 | 1.13 | - | |
| 2025-26 | CAR | 55 | -0.74 | 1.32 | -2.01 | -0.05 | 0.59 | -0.61 | - |
5v5 Individual Stats
| Season | Team(s) | GP | TOI | G/60 | A/60 | Pts/60 | xG/60 | GAE/60 | Sh% | xSh% | Sh%AE | %SA Rush | %SA Reb. |
|---|---|---|---|---|---|---|---|---|---|---|---|---|---|
| 2015-16 | PHI | 64 | 931:25 | 0.45 | 0.77 | 1.22 | 0.23 | 0.22 | 9.59 | 4.89 | 4.70 | 0.00 | 0.90 |
| 2016-17 | PHI | 76 | 1098:24 | 0.16 | 0.33 | 0.49 | 0.29 | -0.12 | 2.59 | 4.55 | -1.96 | 1.69 | 3.39 |
| 2017-18 | PHI | 78 | 1280:28 | 0.19 | 0.89 | 1.08 | 0.22 | -0.03 | 3.33 | 3.93 | -0.60 | 0.56 | 2.26 |
| 2018-19 | PHI | 78 | 1157:37 | 0.21 | 0.73 | 0.93 | 0.23 | -0.03 | 3.96 | 4.46 | -0.50 | 2.84 | 2.84 |
| 2019-20 | PHI | 42 | 609:02 | 0.20 | 0.30 | 0.49 | 0.18 | 0.02 | 4.55 | 4.11 | 0.43 | 0.00 | 1.64 |
| 2020-21 | PHI | 41 | 650:05 | 0.28 | 0.55 | 0.83 | 0.23 | 0.05 | 6.25 | 5.22 | 1.03 | 1.35 | 5.41 |
| 2021-22 | ARI | 82 | 1411:37 | 0.47 | 0.85 | 1.32 | 0.21 | 0.26 | 10.68 | 4.77 | 5.91 | 0.00 | 1.36 |
| 2022-23 | ARI | 52 | 909:52 | 0.26 | 0.73 | 0.99 | 0.24 | 0.03 | 5.71 | 5.11 | 0.61 | 3.00 | 0.00 |
| 2022-23 | CAR | 23 | 322:01 | 0.00 | 0.75 | 0.75 | 0.22 | -0.22 | 0.00 | 5.33 | -5.33 | 0.00 | 4.65 |
| 2022-23 | ARI, CAR | 75 | 1231:53 | 0.19 | 0.73 | 0.93 | 0.23 | -0.04 | 4.35 | 5.16 | -0.81 | 2.10 | 1.40 |
| 2023-24 | DET | 81 | 1164:27 | 0.36 | 0.72 | 1.08 | 0.19 | 0.17 | 8.97 | 4.72 | 4.26 | 0.00 | 2.65 |
| 2024-25 | CAR | 70 | 991:17 | 0.18 | 0.61 | 0.79 | 0.23 | -0.05 | 4.00 | 5.07 | -1.07 | 0.00 | 6.06 |
| 2025-26 | CAR | 55 | 822:39 | 0.44 | 1.46 | 1.90 | 0.30 | 0.13 | 7.32 | 5.09 | 2.22 | 0.76 | 3.79 |
5v5 On Ice Stats
| Season | Team(s) | GP | TOI | SAF/60 | GF/60 | xGF/60 | SAA/60 | GA/60 | xGA/60 | GF% | xGF% | xGF Rel | xGA Rel | xGF% Rel |
|---|---|---|---|---|---|---|---|---|---|---|---|---|---|---|
| 2015-16 | PHI | 64 | 931:25 | 40.52 | 2.77 | 2.20 | 39.49 | 1.87 | 2.19 | 59.72 | 50.16 | 0.09 | 0.11 | -0.28 |
| 2016-17 | PHI | 76 | 1098:24 | 45.56 | 1.53 | 2.36 | 41.13 | 2.57 | 2.38 | 37.33 | 49.75 | 0.33 | 0.30 | 0.40 |
| 2017-18 | PHI | 78 | 1280:28 | 41.80 | 2.67 | 2.29 | 38.19 | 1.97 | 2.03 | 57.58 | 53.00 | 0.15 | -0.29 | 4.99 |
| 2018-19 | PHI | 78 | 1157:37 | 43.17 | 2.18 | 2.35 | 41.52 | 3.01 | 2.37 | 42.00 | 49.79 | -0.01 | -0.17 | 1.57 |
| 2019-20 | PHI | 42 | 609:02 | 40.69 | 2.07 | 2.26 | 37.24 | 2.27 | 2.53 | 47.73 | 47.23 | -0.25 | 0.06 | -3.27 |
| 2020-21 | PHI | 41 | 650:05 | 41.26 | 3.14 | 2.48 | 38.30 | 2.77 | 2.16 | 53.12 | 53.36 | 0.17 | -0.15 | 3.53 |
| 2021-22 | ARI | 82 | 1411:37 | 35.75 | 2.42 | 2.20 | 48.03 | 3.19 | 2.93 | 43.18 | 42.97 | 0.15 | 0.11 | 0.85 |
| 2022-23 | ARI | 52 | 909:52 | 39.83 | 2.70 | 2.58 | 45.04 | 2.97 | 2.95 | 47.67 | 46.64 | 0.56 | 0.12 | 4.96 |
| 2022-23 | CAR | 23 | 322:01 | 51.05 | 2.05 | 3.04 | 26.09 | 1.86 | 1.59 | 52.38 | 65.74 | 0.19 | -0.81 | 11.41 |
| 2022-23 | ARI, CAR | 75 | 1231:53 | 42.76 | 2.53 | 2.70 | 40.08 | 2.68 | 2.59 | 48.60 | 51.01 | 0.39 | -0.09 | 4.74 |
| 2023-24 | DET | 81 | 1164:27 | 38.03 | 2.16 | 2.20 | 42.20 | 2.37 | 2.41 | 47.73 | 47.77 | -0.02 | -0.30 | 2.77 |
| 2024-25 | CAR | 70 | 991:17 | 49.63 | 2.66 | 3.09 | 32.26 | 2.24 | 2.18 | 54.32 | 58.64 | 0.23 | -0.19 | 4.00 |
| 2025-26 | CAR | 55 | 822:39 | 51.27 | 3.43 | 3.36 | 35.01 | 2.55 | 2.40 | 57.32 | 58.35 | 0.38 | 0.00 | 2.91 |
NHL Edge Stats
| Skating | Shooting | Zone Time | |||||||||||
|---|---|---|---|---|---|---|---|---|---|---|---|---|---|
| Season | GP | Top Speed | Bursts>20/mi | Avg. Speed | Top Speed | Avg. Speed | %Long Range | %Mid Range | %High Danger | ES DZ% | ES NZ% | ES OZ% | |
| This table is for Basic and Premium subscribers only. To view please login to and/or subscribe to one of our subscription plans. | |||||||||||||
Legend
| Percentile 0-25 | Percentile 25-50 | Percentile 50-75 | Percentile 75-100 |
5v5 Defense Pairs
| Season | Teammate | Team | TOI | GF/60 | GA/60 | GF% | xGF/60 | xGA/60 | xGF% | xGF Rel | xGA Rel | xGF% Rel |
|---|
Glossary
| Type | Statistic | Definition |
|---|---|---|
| Individual | G/60 | Goals Against per 60 minutes. |
| Individual | A/60 | Assists per 60 minutes. |
| Individual | Pts/60 | Points per 60 minutes. |
| Individual | xG/60 | Expected Goals per 60 minutes. |
| Individual | GAE/60 | Goals Above Expected (G/60 - xG/60). |
| Individual | Sh% | Shooting Percentage. |
| Individual | xSh% | Expected Shooting Percentage. |
| Individual | Sh%AE | Shooting percentage above expected (Sh% - xSh%). |
| Individual | %SA Rush | Percentage of shot attempts determined to be on the rush. |
| Individual | %SA Reb. | Percentage of shot attempts determined to be from rebounds. |
| On Ice | SAF/60 | Shot Attempts For per 60 minutes. |
| On Ice | GF/60 | Goals For per 60 minutes. |
| On Ice | xGF/60 | Expected Goals For per 60 minutes. |
| On Ice | SAA/60 | Shot Attempts Against per 60 minutes (lower is better). |
| On Ice | GA/60 | Goals Against per 60 minutes (lower is better). |
| On Ice | xGA/60 | Expected Goals Against per 60 minutes (lower is better). |
| On Ice | GF% | Goals For Percentage = Goals For / (Goals For + Goals Against) |
| On Ice | xGF% | Expected Goals For Percentage = Expected Goals For / (Expected Goals For + Expected Goals Against) |
| On Ice | xGF Rel | xGF/60 when On Ice - xGF/60 when not On Ice. |
| On Ice | xGA Rel | xGA/60 when On Ice - xGA/60 when not On Ice (lower is better). |
| On Ice | xGF% Rel | xGF% when On Ice - xGF% when not On Ice. |
News and Opinions
-
How Steve Yzerman failed as general manager of the Red Wings at Octopus Thrower (Wed Jul 22, 2026)
-
3 Priority Contract Extensions for the Carolina Hurricanes This Season at The Hockey Writers (Tue Jul 7, 2026)
-
Gostisbehere becomes just second Florida-Born Stanley Cup champion at The Rat Trick (Mon Jun 15, 2026)
-
Former Red Wing Shayne Gostisbehere Leads Hurricanes Defensemen In Cup Final Scoring at Yahoo Sports NHL (Sat Jun 13, 2026)
-
Flyers Meet with NHL Draft Prospect Compared to Shayne Gostisbehere at Yahoo Sports NHL (Sat Jun 6, 2026)
-
Hurricanes’ Morning Presser – Gostisbehere, Andersen, & Brind’Amour Comments After Game 2 at The Hockey Writers (Fri Jun 5, 2026)
-
Brind’Amour, Gostisbehere & Jarvis Speak on Hurricanes’ Game 1 Loss at The Hockey Writers (Wed Jun 3, 2026)
-
Former Red Wings defenseman on the cusp of the Stanley Cup at Octopus Thrower (Sun May 31, 2026)
-
Flyers fans still have someone worth rooting for in the playoffs at Pens Labyrinth (Mon May 18, 2026)
-
Hurricanes’ Shayne Gostisbehere’s Emerging Role as a Two-Way Defenseman at The Hockey Writers (Sat Apr 4, 2026)
-
3 Takeaways From Hurricanes’ 5-2 Regular Season Sweep of Devils at The Hockey Writers (Sun Mar 29, 2026)
-
Gostisbehere sparks Hurricanes’ 5th straight win, 5-2 over Red Wings at Yahoo Sports NHL (Sun Mar 1, 2026)
-
The Hurricanes refuse to quit, erase a 2-goal deficit in under 2 minutes to stun Utah at Cardiac Cane (Fri Jan 30, 2026)
-
Red Wings-Hurricanes Tweetcap: egg-laying made easy in Carolina’s 5-2 win at The Malik Report (Sat Dec 27, 2025)
-
Hurricanes’ Shayne Gostisbehere Should Be Involved in USA Olympic Hockey Discussions at The Hockey Writers (Fri Dec 19, 2025)
-
Carolina Hurricanes’ 3 Stars of November at The Hockey Writers (Tue Dec 2, 2025)
-
The Hurricanes fail to give thanks, open the homestand with a loss to the Rangers at Cardiac Cane (Thu Nov 27, 2025)
-
'Just Thankful To Have The Opportunity To Come Back': Shayne Gostisbehere Set To Return From Injury Against Capitals at Yahoo Sports NHL (Tue Nov 11, 2025)
-
Jamie Drysdale and Cam York are good hockey players at Flyer Nation (Thu Oct 30, 2025)
-
Canes lose Gostisbehere, adding to injury woes at ESPN (Wed Oct 29, 2025)
-
Carolina Hurricanes get good news on the injury front ahead of Tuesday's home contest at Cardiac Cane (Mon Oct 27, 2025)
-
Hurricanes Notebook: Whalers Throwback Jerseys & No Gostisbehere at The Hockey Writers (Wed Oct 22, 2025)
-
Hurricanes’ Hot Start Leans on the Back of Multiple Point Streaks at The Hockey Writers (Fri Oct 17, 2025)
-
Jarvis & Gostisbehere Each Tally 3 Points in Hurricanes’ 4-1 Win Over Ducks at The Hockey Writers (Fri Oct 17, 2025)
-
Revisiting Flyers’ Shayne Gostisbehere Trade at The Hockey Writers (Thu Oct 9, 2025)
-
After a slight shakeup, Shayne Gostisbehere is the top offensive option on defense at Cardiac Cane (Tue Sep 2, 2025)
-
3 Bold Carolina Hurricanes Predictions for the 2025-26 Season at The Hockey Writers (Sat Aug 23, 2025)
-
Hurricanes’ Refurbished Defense Raises Lineup Questions at The Hockey Writers (Fri Aug 15, 2025)
-
One of the Flyers worst trades still haunt them to this day at Broad Street Buzz (Wed Jul 23, 2025)
Current Contract
Shayne Gostisbehere signed a $9,600,000 3-year contract with the Carolina Hurricanes and General Manager Eric Tulsky on July 1, 2024 with an AAV of $3,200,000. This contract will start in 2024-25 and end after the 2026-27 season. In the first season of the contract the cap hit was equivalent to 3.64% of the salary cap.
Standard Contract (UFA) ( ) (0 ratings)
Shayne Gostisbehere signed a $4,125,000 1-year contract with the Detroit Red Wings and General Manager Steve Yzerman on July 1, 2023 with an AAV of $4,125,000. This contract will start in 2023-24 and end after the 2023-24 season. In the first season of the contract the cap hit was equivalent to 4.94% of the salary cap.
Standard Contract (UFA) ( ) (0 ratings)
| Season | Age* | Clause | Cap Hit | AAV | Perf. Bonus | Sign. Bonus | Salary | Compensation | Minors Salary | Status | |
|---|---|---|---|---|---|---|---|---|---|---|---|
| 2023-24 | 30 | M-NTC | $4,125,000 | $4,125,000 | - | - | $4,125,000 | $4,125,000 | $4,125,000 | UFA | |
| Total | - | - | $4,125,000 | $4,125,000 | $4,125,000 |
Shayne Gostisbehere signed a $27,000,000 6-year contract with the Philadelphia Flyers and General Manager Ron Hextall on June 9, 2017 with an AAV of $4,500,000. This contract will start in 2017-18 and end after the 2022-23 season. In the first season of the contract the cap hit was equivalent to 6.00% of the salary cap.
Standard Contract (RFA) ( ) (0 ratings)
| Season | Age* | Clause | Cap Hit | AAV | Perf. Bonus | Sign. Bonus | Salary | Compensation | Minors Salary | Status | |
|---|---|---|---|---|---|---|---|---|---|---|---|
| 2017-18 | 24 | $4,500,000 | $4,500,000 | - | $4,500,000 | $1,500,000 | $6,000,000 | $6,000,000 | 10.2(c) | ||
| 2018-19 | 25 | $4,500,000 | $4,500,000 | - | - | $6,000,000 | $6,000,000 | $6,000,000 | RFA-arb | ||
| 2019-20 | 26 | $4,500,000 | $4,500,000 | - | $2,000,000 | $3,250,000 | $5,250,000 | $5,250,000 | RFA-arb | ||
| 2020-21 | 27 | $4,500,000 | $4,500,000 | - | - | $3,250,000 | $3,250,000 | $3,250,000 | UFA | ||
| 2021-22 | 28 | $4,500,000 | $4,500,000 | - | $2,250,000 | $1,000,000 | $3,250,000 | $3,250,000 | UFA | ||
| 2022-23 | 29 | $4,500,000 | $4,500,000 | - | $2,250,000 | $1,000,000 | $3,250,000 | $3,250,000 | UFA | ||
| Total | - | $11,000,000 | $16,000,000 | $27,000,000 | $27,000,000 |
Shayne Gostisbehere signed a $2,775,000 3-year contract with the Philadelphia Flyers and General Manager Ron Hextall on May 26, 2014 with an AAV of $925,000. This contract will start in 2014-15 and end after the 2016-17 season. In the first season of the contract the cap hit was equivalent to 1.34% of the salary cap.
Entry Level Contract ( ) (0 ratings)
| Season | Age* | Clause | Cap Hit | AAV | Perf. Bonus | Sign. Bonus | Salary | Compensation | Minors Salary | Status | |
|---|---|---|---|---|---|---|---|---|---|---|---|
| 2014-15 | 21 | $925,000 | $1,420,833 | $212,500 | $92,500 | $832,500 | $925,000 | $70,000 | ELC | ||
| 2015-16 | 22 | $925,000 | $1,420,833 | $637,500 | $92,500 | $832,500 | $925,000 | $70,000 | ELC | ||
| 2016-17 | 23 | $925,000 | $1,420,833 | $637,500 | $92,500 | $832,500 | $925,000 | $70,000 | ELC | ||
| Total | $1,487,500 | $277,500 | $2,497,500 | $2,775,000 | $210,000 |
Career Statistics
| Regular Season | Playoffs | |||||||||||||||||||
|---|---|---|---|---|---|---|---|---|---|---|---|---|---|---|---|---|---|---|---|---|
| Season | League | Team | GP | G | A | Pts | +/- | PIM | Shots | Sh% | TOI/G | GP | G | A | Pts | +/- | PIM | Shots | Sh% | TOI/G |
| 2009-10 | USHS-Prep | South Kent Prep. | 33 | 6 | 27 | 33 | ||||||||||||||
| 2010-11 | High-CT | South Kent | 24 | 7 | 29 | 36 | 32 | |||||||||||||
| 2011-12 | ECAC | Union College | 41 | 5 | 17 | 22 | 20 | |||||||||||||
| 2012-13 | ECAC | Union College | 36 | 8 | 18 | 26 | 39 | |||||||||||||
| 2013-14 | ECAC | Union College | 42 | 9 | 25 | 34 | 26 | |||||||||||||
| 2013-14 | AHL | Adirondack Phantoms | 2 | 0 | 0 | 0 | -2 | 6 | 0.0 | |||||||||||
| 2014-15 | AHL | Lehigh Valley | 5 | 0 | 5 | 5 | -1 | 10 | 0.0 | |||||||||||
| 2014-15 | NHL | Philadelphia Flyers | 2 | 0 | 0 | 0 | -2 | 2 | 0.0 | 12:34 | ||||||||||
| 2015-16 | AHL | Lehigh Valley | 14 | 2 | 8 | 10 | -2 | 6 | 41 | 490.0 | ||||||||||
| 2015-16 | NHL | Philadelphia Flyers | 64 | 17 | 29 | 46 | +8 | 24 | 152 | 11.2 | 20:05 | 6 | 1 | 1 | 2 | 4 | 12 | 8.3 | 20:33 | |
| 2016-17 | NHL | Philadelphia Flyers | 76 | 7 | 32 | 39 | -21 | 32 | 198 | 3.5 | 19:36 | |||||||||
| 2016-17 | WCup | Team North America | 3 | 0 | 4 | 4 | +4 | 4 | ||||||||||||
| 2017-18 | NHL | Philadelphia Flyers | 78 | 13 | 52 | 65 | +10 | 25 | 221 | 5.9 | 21:27 | 6 | 1 | 1 | -8 | 4 | 16 | 6.2 | 20:42 | |
| 2018-19 | NHL | Philadelphia Flyers | 78 | 9 | 28 | 37 | -20 | 22 | 180 | 5.0 | 19:40 | |||||||||
| 2019-20 | AHL | Lehigh Valley Phantoms | 2 | 0 | 1 | 1 | -1 | |||||||||||||
| 2019-20 | NHL | Philadelphia Flyers | 42 | 5 | 7 | 12 | -4 | 20 | 73 | 6.8 | 18:18 | 5 | 2 | 2 | +2 | 2 | 10 | 0.0 | 16:36 | |
| 2020-21 | NHL | Philadelphia Flyers | 41 | 9 | 11 | 20 | -2 | 6 | 85 | 10.6 | 19:56 | |||||||||
| 2021-22 | NHL | Arizona Coyotes | 82 | 14 | 37 | 51 | -23 | 26 | 151 | 9.3 | 22:11 | |||||||||
| 2022-23 | NHL | Arizona Coyotes | 52 | 10 | 21 | 31 | -6 | 28 | 115 | 8.7 | 22:30 | |||||||||
| 2022-23 | NHL | Carolina Hurricanes | 23 | 3 | 7 | 10 | +1 | 4 | 40 | 7.5 | 17:00 | 15 | 3 | 3 | -2 | 6 | 24 | 0.0 | 18:00 | |
| 2023-24 | NHL | Detroit Red Wings | 81 | 10 | 46 | 56 | -16 | 16 | 139 | 7.2 | 19:05 | |||||||||
| 2024-25 | NHL | Carolina Hurricanes | 70 | 7 | 38 | 45 | +1 | 52 | 122 | 5.7 | 18:31 | 15 | 3 | 6 | 9 | -9 | 4 | 24 | 12.5 | 18:56 |
| 2025-26 | NHL | Carolina Hurricanes | 55 | 13 | 37 | 50 | +11 | 22 | 116 | 11.2 | 19:14 | 19 | 3 | 9 | 12 | +2 | 14 | 26 | 11.5 | 17:53 |
| NHL Career | 744 | 117 | 345 | 462 | -63 | 277 | 1594 | 7.3 | 20:00 | 66 | 8 | 21 | 29 | -15 | 34 | 112 | 7.1 | 18:33 | ||