
 Kasperi Kapanen
| Position | Right Wing | Current Team | Edmonton Oilers |
| Shoots | Right | Current Contract | |
| Height | 6'1" | Expires | |
| Weight (lbs) | 194 | Expiry Age (Jun 30) | |
| Age (DOB) | 29 (July 23, 1996) | Expiry Status | |
| Drafted | 2014, Round 1, Overall 22 (PIT) |
| Date | Team | Transaction | |
|---|---|---|---|
| Jan 6, 2026 | Edmonton Oilers | Activated from LTIR | |
| Nov 10, 2025 | Edmonton Oilers | Placed on LTIR | |
| Oct 23, 2025 | Edmonton Oilers | Placed on IR | |
| Jun 30, 2025 | Edmonton Oilers | Signed 1 year @ $1.300M AAV starting in 2025-26 | |
| Nov 19, 2024 | Edmonton Oilers | Claimed on Waivers from St. Louis Blues | |
| Nov 19, 2024 | St. Louis Blues | Lost on Waivers to Edmonton Oilers | |
| Nov 18, 2024 | St. Louis Blues | Placed on Waivers | |
| Jul 1, 2024 | St. Louis Blues | Signed 1 year @ $1.000M AAV starting in 2024-25 | |
| Jul 21, 2022 | Pittsburgh Penguins | Signed 2 years @ $3.200M AAV starting in 2022-23 | |
| Jun 28, 2019 | Toronto Maple Leafs | Signed 3 years @ $3.200M AAV starting in 2019-20 | |
| Jul 12, 2014 | Pittsburgh Penguins | Signed to an entry level contract. |
Player Card(s)
URL: https://thestanleycap.com/cdn/player_cards/20252026/kasperi-kapanen-8477953.png
URL: https://thestanleycap.com/cdn/player_cards/20242025/kasperi-kapanen-8477953.png
URL: https://thestanleycap.com/cdn/player_cards/20232024/kasperi-kapanen-8477953.png
About Player Cards
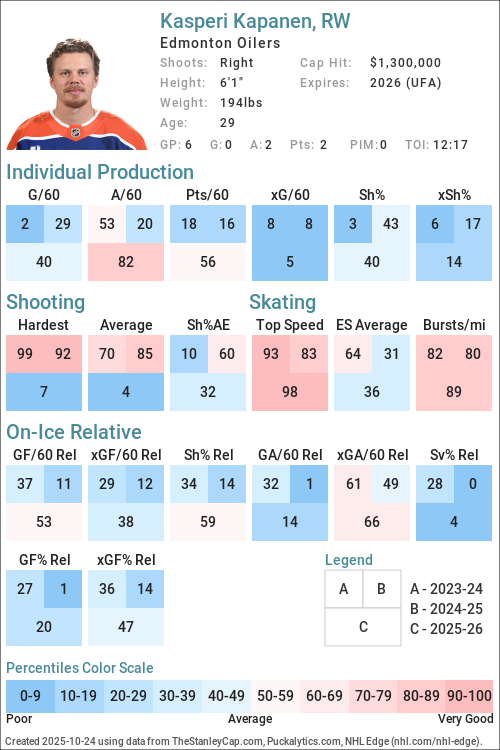
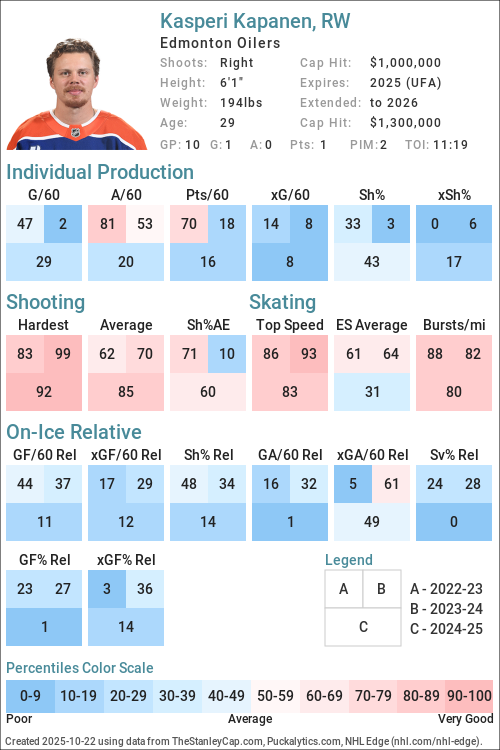
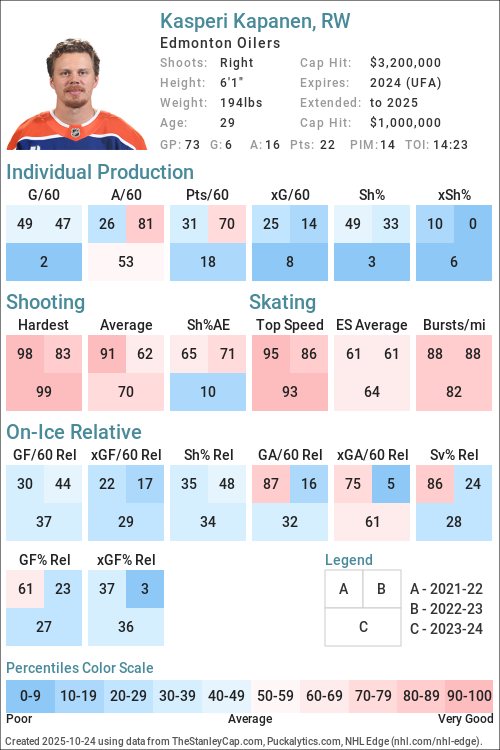
Player cards present an infographic of a players performance using a series of Player Archetypes developed for Puckalytics.com and TheStanleyCap.com. The boxes in the rink image show the archetype ratings for the season specified in the card while the graphs to the right show the five-year trends for those archetypes.
Except for Faceoffs, the values shown are the players z-score (standard deviation from the mean) for the specific metric used to calculate the archetype values. When calculating z-scores forwards were compared to forwards and defensemen were compared to defensemen. Positive values indicate the player is above average and shaded in blue, while negative values indicate the player is below average and shaded in pink. The five year trend charts show a range of -4.0 to 4.0.
The value shown for Faceoffs is the faceoff winning percentage rather than their z-score with winning percentages below 50 in pink shades and above 50 in blue shades.
All archetypes are 5v5 except 5v4 TOI, 4v5 TOI, Skating (even strength) and Faceoffs (all situations). Archetypes use regular season data only.
Archetypes Summary
- Sniper - Measures the to score above the expected goal rate.
- Rebound - Measures the percent of a players shot attempts that come from rebounds (forwards only).
- 5v4 TOI - Powerplay ice time, calculated as the percentage of his teams 5v4 ice time that the player was on the ice for.
- Shooter - Measures whether a players points come from shots (goals or assists on rebounds from his shots).
- Producer - Measures a players ability to produce goals and assists, adjusted for quality of teammates.
- Playmaker - Measures whether a players points come from passes.
- Drive - Measures a players ability to drive puck possession and generate shot attempts for his team.
- Rush - Measures the percent of a players shot attempts that come from rush plays
- Possession - An indicator of a players ability to improve his teams puck possession game.
- Faceoffs - Faceoff Winning Percentage (min. 75 faceoffs taken).
- 5v5 TOI - The percentage of his teams 5v5 TOI that the player was on the ice for.
- Suppress - Measures a players ability to suppress opponent puck possession and shot attempts against.
- Skating - An indicator of a players skating ability, or speed bursts above 20mph per mile skated.
- Defend - An indicator of a players ability to suppress shot quality against.
- 4v5 TOI - Penalty Kill ice time, calculated as the percentage of his teams 4v5 ice time that the player was on the ice for.
Data Sources
- Salary data is from TheStanleyCap.com
- Skating data is from NHL Edge
- Other statistics are from Puckalytics.com and derived from data from NHL.com
Terms of Use
You are free to use include player cards in written articles, share on social media, or on other public websites under the following conditions:
- You credit TheStanleyCap.com as the source and provide a link back to TheStanleyCap.com or this player page.
- You do not mass copy/duplicate/publish dozens or hundreds of player cards. A few, or a handful for a written article is fine. Be reasonable. Fair use rules apply.
- If you are a high-traffic website you must download and host the image(s) on your site rather than overload TheStanleyCap servers with traffic.
Note: Player cards will update daily throughout the season so if you want to include snapshot then you must download the image.
If you have any questions, send an e-mail to the e-mail address at the top of this page.
Read Introducing Player Archetypes on HockeyAnalysis.com for more details on archetype calculations.
Core Archetypes
| Season | Team(s) | GP | TOI | Producer | Playmaker | Shooter | Sniper | Rebound | Rush | Skating | Defend |
|---|---|---|---|---|---|---|---|---|---|---|---|
| 2015-16 | TOR | 9 | - | - | - | -3.15 | 1.09 | -2.06 | - | 3.68 | |
| 2016-17 | TOR | 8 | -0.37 | -1.45 | 3.53 | 0.32 | -2.27 | 1.78 | - | -2.53 | |
| 2017-18 | TOR | 38 | 0.17 | -1.50 | 3.54 | 0.53 | 1.19 | -0.47 | - | 1.50 | |
| 2018-19 | TOR | 78 | 0.12 | -0.11 | 0.06 | -0.44 | -0.88 | 1.11 | - | -0.95 | |
| 2019-20 | TOR | 69 | 0.26 | -0.01 | 0.03 | -0.13 | 0.01 | 0.75 | - | -0.24 | |
| 2020-21 | PIT | 40 | 2.03 | 1.91 | 0.49 | 1.50 | -0.21 | 0.72 | - | -0.11 | |
| 2021-22 | PIT | 79 | -0.59 | -0.92 | 0.02 | 0.27 | -1.82 | 1.43 | 1.18 | 1.17 | |
| 2022-23 | PIT, STL | 66 | 0.82 | 1.52 | -0.41 | 0.47 | -1.23 | 0.21 | 1.23 | -0.66 | |
| 2023-24 | STL | 73 | -0.99 | 0.61 | -1.39 | -1.18 | -0.23 | 1.25 | 0.77 | -0.53 | |
| 2024-25 | EDM, STL | 67 | -0.87 | -0.77 | -0.50 | 0.33 | -0.48 | -1.59 | 0.76 | -3.11 | |
| 2025-26 | EDM | 41 | 0.48 | 0.44 | 0.07 | 0.71 | -1.81 | 1.29 | 0.60 | 0.80 |
Situational and Secondary Archetypes
| Season | Team(s) | GP | TOI | 5v5 TOI | 5v4 TOI | 4v5 TOI | Possession | Drive | Suppress | Faceoffs |
|---|---|---|---|---|---|---|---|---|---|---|
| 2015-16 | TOR | 9 | -0.03 | 0.37 | -1.98 | -0.12 | -0.56 | 0.73 | - | |
| 2016-17 | TOR | 8 | -1.53 | -2.04 | 0.47 | -0.01 | -1.76 | 2.65 | - | |
| 2017-18 | TOR | 38 | -1.50 | -2.08 | 0.11 | 0.61 | -0.82 | 2.40 | - | |
| 2018-19 | TOR | 78 | 0.63 | -1.08 | 0.74 | 0.47 | 0.85 | -0.36 | - | |
| 2019-20 | TOR | 69 | -0.12 | -0.62 | 0.55 | -0.27 | -0.41 | 0.06 | - | |
| 2020-21 | PIT | 40 | 0.45 | -0.19 | -2.10 | 0.30 | 0.02 | 0.51 | - | |
| 2021-22 | PIT | 79 | -0.08 | -0.35 | -2.02 | -0.06 | -0.34 | 0.36 | - | |
| 2022-23 | PIT, STL | 66 | -0.51 | -0.68 | -0.91 | -0.90 | -0.57 | -0.79 | 38.0 | |
| 2023-24 | STL | 73 | -0.02 | -1.35 | -0.05 | 0.18 | 0.12 | 0.10 | - | |
| 2024-25 | EDM, STL | 67 | -1.03 | -1.67 | -0.86 | -0.69 | -1.00 | 0.21 | 41.5 | |
| 2025-26 | EDM | 41 | 0.23 | -1.58 | -0.22 | -0.79 | -1.27 | 0.48 | - |
5v5 Individual Stats
| Season | Team(s) | GP | TOI | G/60 | A/60 | Pts/60 | xG/60 | GAE/60 | Sh% | xSh% | Sh%AE | %SA Rush | %SA Reb. |
|---|---|---|---|---|---|---|---|---|---|---|---|---|---|
| 2015-16 | TOR | 9 | 109:10 | 0.00 | 0.00 | 0.00 | 0.63 | -0.63 | 0.00 | 11.49 | -11.49 | 0.00 | 7.69 |
| 2016-17 | TOR | 8 | 72:38 | 0.83 | 0.00 | 0.83 | 0.74 | 0.08 | 10.00 | 8.98 | 1.02 | 7.69 | 0.00 |
| 2017-18 | TOR | 38 | 369:30 | 0.97 | 0.32 | 1.30 | 0.84 | 0.14 | 12.50 | 10.73 | 1.77 | 3.03 | 7.58 |
| 2018-19 | TOR | 78 | 1061:53 | 0.79 | 1.13 | 1.92 | 0.93 | -0.14 | 9.09 | 10.74 | -1.65 | 6.33 | 3.17 |
| 2019-20 | TOR | 69 | 825:56 | 0.58 | 1.02 | 1.60 | 0.62 | -0.04 | 8.16 | 8.75 | -0.59 | 5.47 | 6.25 |
| 2020-21 | PIT | 40 | 533:03 | 1.01 | 1.80 | 2.81 | 0.57 | 0.44 | 14.75 | 8.32 | 6.43 | 5.26 | 5.26 |
| 2021-22 | PIT | 79 | 965:16 | 0.68 | 0.68 | 1.37 | 0.62 | 0.06 | 10.09 | 9.18 | 0.91 | 6.85 | 1.37 |
| 2022-23 | STL | 23 | 291:01 | 0.82 | 1.24 | 2.06 | 0.56 | 0.26 | 10.53 | 7.20 | 3.33 | 4.17 | 4.17 |
| 2022-23 | PIT | 43 | 439:29 | 0.55 | 1.37 | 1.91 | 0.57 | -0.02 | 7.02 | 7.27 | -0.26 | 4.23 | 2.82 |
| 2022-23 | PIT, STL | 66 | 730:30 | 0.66 | 1.31 | 1.97 | 0.57 | 0.09 | 8.42 | 7.24 | 1.18 | 4.20 | 3.36 |
| 2023-24 | STL | 73 | 888:03 | 0.20 | 0.95 | 1.15 | 0.45 | -0.25 | 3.57 | 7.97 | -4.39 | 6.50 | 7.32 |
| 2024-25 | EDM | 57 | 612:15 | 0.49 | 0.69 | 1.18 | 0.44 | 0.05 | 10.20 | 9.21 | 1.00 | 0.00 | 7.58 |
| 2024-25 | STL | 10 | 109:30 | 0.55 | 0.00 | 0.55 | 0.45 | 0.09 | 9.09 | 7.54 | 1.55 | 0.00 | 0.00 |
| 2024-25 | EDM, STL | 67 | 721:45 | 0.50 | 0.58 | 1.08 | 0.44 | 0.05 | 10.00 | 8.90 | 1.10 | 0.00 | 6.02 |
| 2025-26 | EDM | 41 | 534:54 | 0.79 | 1.01 | 1.79 | 0.63 | 0.15 | 11.67 | 9.41 | 2.25 | 4.65 | 2.33 |
5v5 On Ice Stats
| Season | Team(s) | GP | TOI | SAF/60 | GF/60 | xGF/60 | SAA/60 | GA/60 | xGA/60 | GF% | xGF% | xGF Rel | xGA Rel | xGF% Rel |
|---|---|---|---|---|---|---|---|---|---|---|---|---|---|---|
| 2015-16 | TOR | 9 | 109:10 | 39.57 | 0.00 | 1.82 | 44.52 | 1.65 | 2.45 | 0.00 | 42.60 | -0.33 | -0.09 | -3.27 |
| 2016-17 | TOR | 8 | 72:38 | 37.17 | 0.83 | 2.19 | 36.35 | 2.48 | 2.19 | 25.00 | 50.00 | -0.42 | -0.35 | -0.65 |
| 2017-18 | TOR | 38 | 369:30 | 41.41 | 1.46 | 2.38 | 39.95 | 1.62 | 2.29 | 47.37 | 50.94 | -0.29 | -0.45 | 1.55 |
| 2018-19 | TOR | 78 | 1061:53 | 49.16 | 3.16 | 2.94 | 47.07 | 2.66 | 2.81 | 54.37 | 51.15 | 0.17 | 0.17 | -0.13 |
| 2019-20 | TOR | 69 | 825:56 | 43.30 | 2.11 | 2.42 | 42.79 | 2.91 | 2.63 | 42.03 | 47.92 | -0.34 | 0.16 | -4.88 |
| 2020-21 | PIT | 40 | 533:03 | 38.38 | 3.71 | 2.29 | 37.82 | 2.03 | 2.53 | 64.71 | 47.45 | 0.07 | 0.28 | -2.14 |
| 2021-22 | PIT | 79 | 965:16 | 43.64 | 2.24 | 2.60 | 38.91 | 1.86 | 2.32 | 54.55 | 52.87 | -0.26 | -0.11 | -1.20 |
| 2022-23 | STL | 23 | 291:01 | 38.97 | 3.09 | 2.46 | 46.80 | 2.68 | 3.10 | 53.57 | 44.22 | 0.13 | 0.45 | -2.54 |
| 2022-23 | PIT | 43 | 439:29 | 41.50 | 2.18 | 2.40 | 45.74 | 3.28 | 3.10 | 40.00 | 43.70 | -0.60 | 0.37 | -8.73 |
| 2022-23 | PIT, STL | 66 | 730:30 | 40.49 | 2.55 | 2.43 | 46.16 | 3.04 | 3.10 | 45.59 | 43.91 | -0.35 | 0.40 | -6.76 |
| 2023-24 | STL | 73 | 888:03 | 39.32 | 2.09 | 2.06 | 45.81 | 2.77 | 2.73 | 43.06 | 43.01 | -0.22 | -0.08 | -1.83 |
| 2024-25 | EDM | 57 | 612:15 | 39.89 | 1.96 | 2.49 | 37.63 | 3.63 | 2.40 | 35.09 | 50.88 | -0.50 | 0.04 | -5.01 |
| 2024-25 | STL | 10 | 109:30 | 35.07 | 0.55 | 1.70 | 41.64 | 3.84 | 2.19 | 12.50 | 43.71 | -0.49 | -0.34 | -2.75 |
| 2024-25 | EDM, STL | 67 | 721:45 | 39.15 | 1.75 | 2.37 | 38.24 | 3.66 | 2.37 | 32.31 | 49.99 | -0.50 | -0.01 | -4.61 |
| 2025-26 | EDM | 41 | 534:54 | 36.57 | 2.47 | 2.19 | 37.91 | 2.02 | 2.39 | 55.00 | 47.75 | -0.83 | -0.19 | -6.15 |
NHL Edge Stats
| Skating | Shooting | Zone Time | |||||||||||
|---|---|---|---|---|---|---|---|---|---|---|---|---|---|
| Season | GP | Top Speed | Bursts>20/mi | Avg. Speed | Top Speed | Avg. Speed | %Long Range | %Mid Range | %High Danger | ES DZ% | ES NZ% | ES OZ% | |
| This table is for Basic and Premium subscribers only. To view please login to and/or subscribe to one of our subscription plans. | |||||||||||||
Legend
| Percentile 0-25 | Percentile 25-50 | Percentile 50-75 | Percentile 75-100 |
5v5 Lines
| Season | Teammate | Teammate | Team | TOI | GF/60 | GA/60 | GF% | xGF/60 | xGA/60 | xGF% | xGF Rel | xGA Rel | xGF% Rel |
|---|
Glossary
| Type | Statistic | Definition |
|---|---|---|
| Individual | G/60 | Goals Against per 60 minutes. |
| Individual | A/60 | Assists per 60 minutes. |
| Individual | Pts/60 | Points per 60 minutes. |
| Individual | xG/60 | Expected Goals per 60 minutes. |
| Individual | GAE/60 | Goals Above Expected (G/60 - xG/60). |
| Individual | Sh% | Shooting Percentage. |
| Individual | xSh% | Expected Shooting Percentage. |
| Individual | Sh%AE | Shooting percentage above expected (Sh% - xSh%). |
| Individual | %SA Rush | Percentage of shot attempts determined to be on the rush. |
| Individual | %SA Reb. | Percentage of shot attempts determined to be from rebounds. |
| On Ice | SAF/60 | Shot Attempts For per 60 minutes. |
| On Ice | GF/60 | Goals For per 60 minutes. |
| On Ice | xGF/60 | Expected Goals For per 60 minutes. |
| On Ice | SAA/60 | Shot Attempts Against per 60 minutes (lower is better). |
| On Ice | GA/60 | Goals Against per 60 minutes (lower is better). |
| On Ice | xGA/60 | Expected Goals Against per 60 minutes (lower is better). |
| On Ice | GF% | Goals For Percentage = Goals For / (Goals For + Goals Against) |
| On Ice | xGF% | Expected Goals For Percentage = Expected Goals For / (Expected Goals For + Expected Goals Against) |
| On Ice | xGF Rel | xGF/60 when On Ice - xGF/60 when not On Ice. |
| On Ice | xGA Rel | xGA/60 when On Ice - xGA/60 when not On Ice (lower is better). |
| On Ice | xGF% Rel | xGF% when On Ice - xGF% when not On Ice. |
News and Opinions
-
Oilers News & Rumours: Murphy & Dickinson Extended, Babcock Hiring, Kapanen Leaving? at The Hockey Writers (Tue Jun 23, 2026)
-
Oilers rumours: Kapanen to test market, trade interest in Nurse builds at Oilers Nation (Fri Jun 19, 2026)
-
Oilers 2025-26 Report Cards: Kasperi Kapanen at The Hockey Writers (Thu May 28, 2026)
-
Building the perfect top-six around McDavid and Draisaitl at Oilers Nation (Mon May 25, 2026)
-
Kasperi Kapanen had a productive second season in Edmonton: Oilers 2025-26 player review at Oilers Nation (Sun May 17, 2026)
-
Oilers News & Rumours: Knoblauch’s Status, Howard, Nurse, Kapanen & More at The Hockey Writers (Thu May 7, 2026)
-
The Oilers need to prioritize re-signing Kasperi Kapanen at Oilers Nation (Wed May 6, 2026)
-
Oilers stare down first round exit, Tristan Jarry gets the keys, and a tiny Kasperi Kapanen silver lining at Oilers Nation (Mon Apr 27, 2026)
-
Game 1 notes: Kapanen’s clutch scoring, Walman finding his swagger, observations from behind Oilers’ net, and more at Oilers Nation (Tue Apr 21, 2026)
-
Kapanen’s 2nd goal of game with 1:54 remaining lifts Oilers over Ducks 4-3 in playoff opener at NBC Sports (Tue Apr 21, 2026)
-
Kapanen’s 2nd goal of game with 1:54 remaining lifts Oilers over Ducks 4-3 in playoff opener at Yahoo Sports NHL (Tue Apr 21, 2026)
-
Two-goal nights from Dickinson, Kapanen, lift Oilers to 4-3 Game 1 win over Ducks: Recap, Reaction and Highlights at Oilers Nation (Tue Apr 21, 2026)
-
Two-goal performances from Dickinson, Kapanen, lift Oilers to 4-3 Game 1 win over Ducks: Recap, Reaction and Highlights at Oilers Nation (Mon Apr 20, 2026)
-
An early look at which unrestricted free agents the Oilers should re-sign at Oilers Nation (Tue Mar 24, 2026)
-
Oilers blow two-goal lead in St. Louis, Connor Ingram’s return, and a hat-tip to Kasperi Kapanen at Oilers Nation (Sat Mar 14, 2026)
-
2026 NHL Trade Deadline Live Blog at Oilers Nation (Fri Mar 6, 2026)
-
Oilers injury update: McDavid and Kapanen to miss time, Henrique ready to return to lineup at Oilers Nation (Mon Feb 23, 2026)
-
Oilers Thoughts: Draisaitl’s passionate interview highlights his leadership, Kapanen’s momentum, Mangiapane’s first-period fire, and Jarry’s accountability at Oilers Nation (Fri Feb 6, 2026)
-
4 Oilers Who Have Surprised So Far This Season at The Hockey Writers (Mon Jan 19, 2026)
-
Kasperi Kapanen Has Rejuvenated the Oilers’ Forward Group at The Hockey Writers (Wed Jan 14, 2026)
-
The Day After 43.0: Kapanen shines in first game back in Oilers lineup at Oilers Nation (Wed Jan 7, 2026)
-
Oilers Thoughts: Knoblauch spot-on with Kapanen, McDavid’s double-digit shots, Hutson update, Ingram bounce back, and the new third line at Oilers Nation (Wed Jan 7, 2026)
-
Oilers’ Bottom Six Looked Much Better Without Frederic & Mangiapane at The Hockey Writers (Wed Jan 7, 2026)
-
Connor McDavid hat trick, Leon Draisaitl owns the Predators again, and Kasperi Kapanen’s Oilers return at Oilers Nation (Wed Jan 7, 2026)
-
Oilers activate Kapanen to play Tuesday, Jarry placed on LTIR at Oilers Nation (Tue Jan 6, 2026)
-
Oilersnation Radio: Oilers look to stop the slide, Kasperi Kapanen returns, and healthy scratches at Oilers Nation (Tue Jan 6, 2026)
-
Oilers injury update: Kasperi Kapanen likely to return Tuesday, Jake Walman in a week at Oilers Nation (Mon Jan 5, 2026)
-
Kasperi Kapanen eyeing return to Oilers lineup as early as Tuesday at Oilers Nation (Sun Jan 4, 2026)
-
Revisiting Maple Leafs’ Trade of Phil Kessel to the Penguins at The Hockey Writers (Tue Nov 25, 2025)
-
Kasperi Kapanen has a renewed confidence with the Oilers amid a career marked by struggles at Oilers Nation (Fri Nov 7, 2025)
-
Oilers Lose Winger, Maple Leafs Locker Room Issues & More NHL Rumors at The Hockey Writers (Tue Oct 21, 2025)
-
Oilers Need Kasperi Kapanen to Step Up This Season at The Hockey Writers (Sun Aug 24, 2025)
-
Ex-Maple Leafs Kasperi Kapanen: Where Is He Now? at The Hockey Writers (Thu Aug 14, 2025)
-
Best Oilers Goals of 2024-25: Kasperi Kapanen eliminates Golden Knights in overtime at Oilers Nation (Tue Jul 22, 2025)
-
Oilers 2024-25 Report Cards: Kasperi Kapanen at The Hockey Writers (Sun Jul 20, 2025)
Current Contract
Player does not currently have a contract.Kasperi Kapanen signed a $1,300,000 1-year contract with the Edmonton Oilers and General Manager Stan Bowman on June 30, 2025 with an AAV of $1,300,000. This contract will start in 2025-26 and end after the 2025-26 season. In the first season of the contract the cap hit was equivalent to 1.36% of the salary cap.
Standard Contract (UFA) ( ) (0 ratings)
| Season | Age* | Clause | Cap Hit | AAV | Perf. Bonus | Sign. Bonus | Salary | Compensation | Minors Salary | Status | |
|---|---|---|---|---|---|---|---|---|---|---|---|
| 2025-26 | 29 | $1,300,000 | $1,300,000 | - | - | $1,300,000 | $1,300,000 | $1,300,000 | UFA | ||
| Total | - | - | $1,300,000 | $1,300,000 | $1,300,000 |
Kasperi Kapanen signed a $1,000,000 1-year contract with the St. Louis Blues and General Manager Doug Armstrong on July 1, 2024 with an AAV of $1,000,000. This contract will start in 2024-25 and end after the 2024-25 season. In the first season of the contract the cap hit was equivalent to 1.14% of the salary cap.
Standard Contract (UFA) ( ) (0 ratings)
| Season | Age* | Clause | Cap Hit | AAV | Perf. Bonus | Sign. Bonus | Salary | Compensation | Minors Salary | Status | |
|---|---|---|---|---|---|---|---|---|---|---|---|
| 2024-25 | 28 | $1,000,000 | $1,000,000 | - | - | $1,000,000 | $1,000,000 | $1,000,000 | UFA | ||
| Total | - | - | $1,000,000 | $1,000,000 | $1,000,000 |
Kasperi Kapanen signed a $6,400,000 2-year contract with the Pittsburgh Penguins and General Manager Ron Hextall on July 21, 2022 with an AAV of $3,200,000. This contract will start in 2022-23 and end after the 2023-24 season. In the first season of the contract the cap hit was equivalent to 3.88% of the salary cap.
Standard Contract (RFA) ( ) (0 ratings)
| Season | Age* | Clause | Cap Hit | AAV | Perf. Bonus | Sign. Bonus | Salary | Compensation | Minors Salary | Status | |
|---|---|---|---|---|---|---|---|---|---|---|---|
| 2022-23 | 26 | $3,200,000 | $3,200,000 | - | - | $3,200,000 | $3,200,000 | $3,200,000 | RFA-arb | ||
| 2023-24 | 27 | $3,200,000 | $3,200,000 | - | - | $3,200,000 | $3,200,000 | $3,200,000 | UFA | ||
| Total | - | - | $6,400,000 | $6,400,000 | $6,400,000 |
Kasperi Kapanen signed a $9,600,000 3-year contract with the Toronto Maple Leafs and General Manager Kyle Dubas on June 28, 2019 with an AAV of $3,200,000. This contract will start in 2019-20 and end after the 2021-22 season. In the first season of the contract the cap hit was equivalent to 3.93% of the salary cap.
Standard Contract (RFA) ( ) (0 ratings)
| Season | Age* | Clause | Cap Hit | AAV | Perf. Bonus | Sign. Bonus | Salary | Compensation | Minors Salary | Status | |
|---|---|---|---|---|---|---|---|---|---|---|---|
| 2019-20 | 23 | $3,200,000 | $3,200,000 | - | $3,700,000 | $700,000 | $4,400,000 | $4,400,000 | RFA | ||
| 2020-21 | 24 | $3,200,000 | $3,200,000 | - | $1,000,000 | $1,860,000 | $2,860,000 | $2,860,000 | RFA-arb | ||
| 2021-22 | 25 | $3,200,000 | $3,200,000 | - | $1,540,000 | $800,000 | $2,340,000 | $2,340,000 | RFA-arb | ||
| Total | - | $6,240,000 | $3,360,000 | $9,600,000 | $9,600,000 |
Kasperi Kapanen signed a $2,775,000 3-year contract with the Pittsburgh Penguins and General Manager Jim Rutherford on July 12, 2014 with an AAV of $925,000. This contract will start in 2014-15 and end after the 2018-19 season. In the first season of the contract the cap hit was equivalent to 1.34% of the salary cap.
Entry Level Contract ( ) (0 ratings)
| Season | Age* | Clause | Cap Hit | AAV | Perf. Bonus | Sign. Bonus | Salary | Compensation | Minors Salary | Status | |
|---|---|---|---|---|---|---|---|---|---|---|---|
| 2014-15 | 18 | $925,000 | $925,000 | - | $92,500 | - | $92,500 | - | ELC | ||
| 2015-16 | 19 | $894,167 | $894,167 | - | $92,500 | - | $92,500 | - | ELC | ||
| 2016-17 | 20 | $863,333 | $863,333 | - | $92,500 | $832,500 | $925,000 | $70,000 | ELC | ||
| 2017-18 | 21 | $863,333 | $863,333 | - | - | $832,500 | $832,500 | $70,000 | ELC | ||
| 2018-19 | 22 | $863,333 | $863,333 | - | - | $832,500 | $832,500 | $70,000 | ELC | ||
| Total | - | $277,500 | $2,497,500 | $2,775,000 | $210,000 |
Career Statistics
| Regular Season | Playoffs | |||||||||||||||||||
|---|---|---|---|---|---|---|---|---|---|---|---|---|---|---|---|---|---|---|---|---|
| Season | League | Team | GP | G | A | Pts | +/- | PIM | Shots | Sh% | TOI/G | GP | G | A | Pts | +/- | PIM | Shots | Sh% | TOI/G |
| 2010-11 | Jr. C SM-sarja | KalPa U16 | 26 | 14 | 8 | 22 | 10 | |||||||||||||
| 2011-12 | Fin-U18 | KalPa U18 | 27 | 13 | 11 | 24 | 8 | 2 | ||||||||||||
| 2012-13 | Fin-Jr. | KalPa Jr. | 36 | 14 | 15 | 29 | 16 | |||||||||||||
| 2012-13 | Fin-U18 | KalPa U18 | 3 | 3 | 3 | 6 | ||||||||||||||
| 2012-13 | Finland | KalPa | 13 | 4 | 0 | 4 | 2 | 4 | 1 | 1 | 2 | |||||||||
| 2013-14 | Finland | KalPa | 47 | 7 | 7 | 14 | 10 | |||||||||||||
| 2013-14 | WJ18-A | Finland | 5 | 1 | 1 | 2 | -3 | 18 | ||||||||||||
| 2013-14 | Fin-U18 | KalPa U18 | 2 | 5 | 1 | 6 | 4 | 6 | 1 | 7 | ||||||||||
| 2014-15 | WJC-A | Finland | 5 | 1 | 0 | 1 | -1 | 6 | ||||||||||||
| 2014-15 | AHL | Wilkes-Barre | 4 | 1 | 1 | 2 | -1 | 9 | 1,110.0 | 7 | 3 | 2 | 5 | 12 | 2,500.0 | |||||
| 2014-15 | Finland | KalPa | 41 | 11 | 10 | 21 | 14 | 6 | 5 | 5 | 2 | |||||||||
| 2015-16 | NHL | Toronto Maple Leafs | 9 | 0 | 0 | 0 | -3 | 2 | 14 | 0.0 | 14:47 | |||||||||
| 2015-16 | WJC-20 | Finland U20 | 7 | 2 | 3 | 5 | -2 | 2 | ||||||||||||
| 2015-16 | AHL | Toronto | 44 | 9 | 16 | 25 | +7 | 8 | 65 | 1,380.0 | 14 | 3 | 5 | 8 | +1 | 2 | 14 | 2,140.0 | ||
| 2016-17 | AHL | Toronto Marlies | 43 | 18 | 25 | 43 | +2 | 16 | 9 | 2 | 6 | 8 | -2 | 8 | ||||||
| 2016-17 | NHL | Toronto Maple Leafs | 8 | 1 | 0 | 1 | -2 | 11 | 9.1 | 10:42 | 6 | 2 | 2 | -2 | 8 | 25.0 | 10:48 | |||
| 2017-18 | AHL | Toronto Marlies | 28 | 12 | 12 | 24 | +8 | 12 | ||||||||||||
| 2017-18 | WC | Finland | 8 | 3 | 0 | 3 | +1 | |||||||||||||
| 2017-18 | NHL | Toronto Maple Leafs | 38 | 7 | 2 | 9 | -1 | 4 | 55 | 12.7 | 11:15 | 7 | 1 | 1 | -3 | 6 | 16.7 | 11:16 | ||
| 2018-19 | NHL | Toronto Maple Leafs | 78 | 20 | 24 | 44 | +12 | 27 | 174 | 11.5 | 16:37 | 7 | 1 | 1 | 2 | -1 | 2 | 18 | 5.6 | 17:10 |
| 2019-20 | NHL | Toronto Maple Leafs | 69 | 13 | 23 | 36 | 22 | 121 | 10.7 | 15:47 | 5 | 2 | 2 | -2 | 14 | 9 | 0.0 | 16:18 | ||
| 2020-21 | NHL | Pittsburgh Penguins | 40 | 11 | 19 | 30 | +15 | 7 | 68 | 16.2 | 15:32 | 6 | 1 | 2 | 3 | -3 | 12 | 8.3 | 17:04 | |
| 2021-22 | NHL | Pittsburgh Penguins | 79 | 11 | 21 | 32 | +2 | 16 | 129 | 8.5 | 14:32 | 7 | 3 | 3 | +4 | 2 | 19 | 0.0 | 15:53 | |
| 2022-23 | NHL | Pittsburgh Penguins | 43 | 7 | 13 | 20 | -8 | 8 | 69 | 10.1 | 12:02 | |||||||||
| 2022-23 | NHL | St. Louis Blues | 23 | 8 | 6 | 14 | 10 | 47 | 17.0 | 16:45 | ||||||||||
| 2023-24 | NHL | St. Louis Blues | 73 | 6 | 16 | 22 | -5 | 14 | 99 | 6.1 | 14:23 | |||||||||
| 2024-25 | NHL | St. Louis Blues | 10 | 1 | 0 | 1 | -6 | 2 | 11 | 9.1 | 11:19 | |||||||||
| 2024-25 | NHL | Edmonton Oilers | 57 | 5 | 8 | 13 | -16 | 14 | 55 | 9.1 | 12:01 | 12 | 3 | 3 | 6 | +4 | 18 | 27 | 11.1 | 13:28 |
| 2025-26 | NHL | Edmonton Oilers | 41 | 8 | 9 | 17 | +5 | 14 | 65 | 12.3 | 14:35 | 6 | 4 | 2 | 6 | +7 | 15 | 26.7 | 17:53 | |
| NHL Career | 568 | 98 | 141 | 239 | -7 | 140 | 918 | 10.7 | 14:21 | 56 | 12 | 13 | 25 | +4 | 36 | 114 | 10.5 | 14:47 | ||