
 Dante Fabbro
| Position | Right Defense | Current Team | Columbus Blue Jackets |
| Shoots | Right | Current Contract | 4 years ($4.1M CapHit) |
| Height | 6'0" | Expires | 2028-29 |
| Weight (lbs) | 200 | Expiry Age (Jun 30) | 31 |
| Age (DOB) | 28 (June 20, 1998) | Expiry Status | UFA |
| Drafted | 2016, Round 1, Overall 17 (NSH) |
| Date | Team | Transaction | |
|---|---|---|---|
| Jun 29, 2025 | Columbus Blue Jackets | Signed 4 years @ $4.125M AAV starting in 2025-26 | |
| Nov 10, 2024 | Columbus Blue Jackets | Claimed on Waivers from Nashville Predators | |
| Nov 10, 2024 | Nashville Predators | Lost on Waivers to Columbus Blue Jackets | |
| Nov 9, 2024 | Nashville Predators | Placed on Waivers | |
| Mar 8, 2024 | Nashville Predators | Signed 1 year @ $2.500M AAV starting in 2024-25 | |
| Mar 3, 2023 | Nashville Predators | Signed 1 year @ $2.500M AAV starting in 2023-24 | |
| Aug 5, 2021 | Nashville Predators | Signed 2 years @ $2.400M AAV starting in 2021-22 | |
| Mar 27, 2019 | Nashville Predators | Signed to an entry level contract. |
Player Card(s)
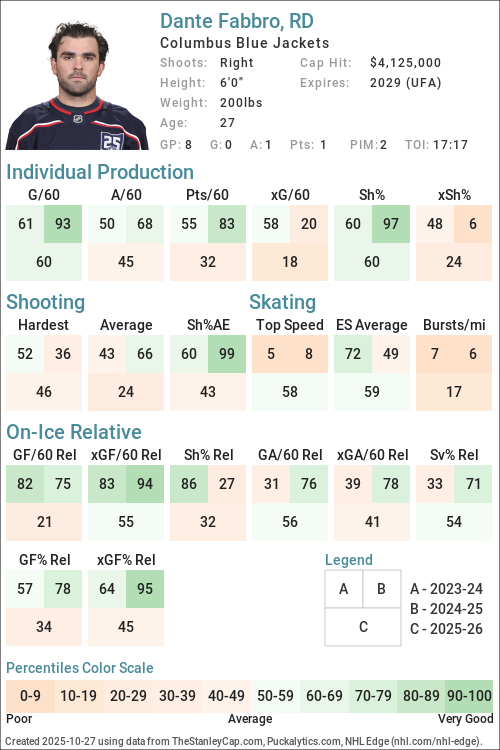
URL: https://thestanleycap.com/cdn/player_cards/20252026/dante-fabbro-8479371.png
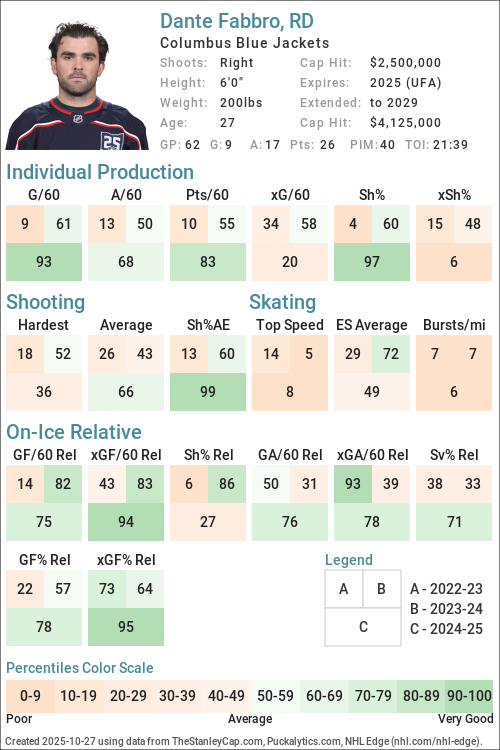
URL: https://thestanleycap.com/cdn/player_cards/20242025/dante-fabbro-8479371.png
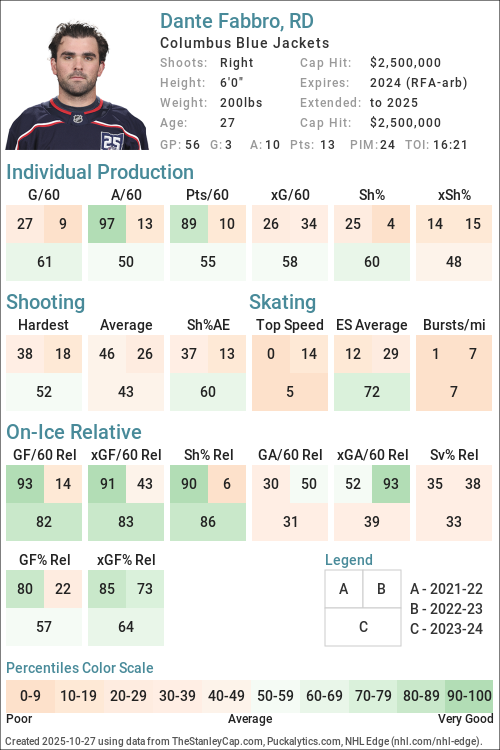
URL: https://thestanleycap.com/cdn/player_cards/20232024/dante-fabbro-8479371.png
About Player Cards
Player cards present an infographic of a players performance using a series of Player Archetypes developed for Puckalytics.com and TheStanleyCap.com. The boxes in the rink image show the archetype ratings for the season specified in the card while the graphs to the right show the five-year trends for those archetypes.
Except for Faceoffs, the values shown are the players z-score (standard deviation from the mean) for the specific metric used to calculate the archetype values. When calculating z-scores forwards were compared to forwards and defensemen were compared to defensemen. Positive values indicate the player is above average and shaded in blue, while negative values indicate the player is below average and shaded in pink. The five year trend charts show a range of -4.0 to 4.0.
The value shown for Faceoffs is the faceoff winning percentage rather than their z-score with winning percentages below 50 in pink shades and above 50 in blue shades.
All archetypes are 5v5 except 5v4 TOI, 4v5 TOI, Skating (even strength) and Faceoffs (all situations). Archetypes use regular season data only.
Archetypes Summary
- Sniper - Measures the to score above the expected goal rate.
- Rebound - Measures the percent of a players shot attempts that come from rebounds (forwards only).
- 5v4 TOI - Powerplay ice time, calculated as the percentage of his teams 5v4 ice time that the player was on the ice for.
- Shooter - Measures whether a players points come from shots (goals or assists on rebounds from his shots).
- Producer - Measures a players ability to produce goals and assists, adjusted for quality of teammates.
- Playmaker - Measures whether a players points come from passes.
- Drive - Measures a players ability to drive puck possession and generate shot attempts for his team.
- Rush - Measures the percent of a players shot attempts that come from rush plays
- Possession - An indicator of a players ability to improve his teams puck possession game.
- Faceoffs - Faceoff Winning Percentage (min. 75 faceoffs taken).
- 5v5 TOI - The percentage of his teams 5v5 TOI that the player was on the ice for.
- Suppress - Measures a players ability to suppress opponent puck possession and shot attempts against.
- Skating - An indicator of a players skating ability, or speed bursts above 20mph per mile skated.
- Defend - An indicator of a players ability to suppress shot quality against.
- 4v5 TOI - Penalty Kill ice time, calculated as the percentage of his teams 4v5 ice time that the player was on the ice for.
Data Sources
- Salary data is from TheStanleyCap.com
- Skating data is from NHL Edge
- Other statistics are from Puckalytics.com and derived from data from NHL.com
Terms of Use
You are free to use include player cards in written articles, share on social media, or on other public websites under the following conditions:
- You credit TheStanleyCap.com as the source and provide a link back to TheStanleyCap.com or this player page.
- You do not mass copy/duplicate/publish dozens or hundreds of player cards. A few, or a handful for a written article is fine. Be reasonable. Fair use rules apply.
- If you are a high-traffic website you must download and host the image(s) on your site rather than overload TheStanleyCap servers with traffic.
Note: Player cards will update daily throughout the season so if you want to include snapshot then you must download the image.
If you have any questions, send an e-mail to the e-mail address at the top of this page.
Read Introducing Player Archetypes on HockeyAnalysis.com for more details on archetype calculations.
Core Archetypes
| Season | Team(s) | GP | TOI | Producer | Playmaker | Shooter | Sniper | Rebound | Rush | Skating | Defend |
|---|---|---|---|---|---|---|---|---|---|---|---|
| 2018-19 | NSH | 4 | 5.44 | -1.66 | 46.14 | 9.04 | - | -1.03 | - | -1.87 | |
| 2019-20 | NSH | 64 | -1.00 | -1.09 | -0.37 | 0.32 | - | -0.15 | - | -0.51 | |
| 2020-21 | NSH | 40 | 0.32 | 1.07 | -0.70 | -0.04 | - | 0.43 | - | 0.44 | |
| 2021-22 | NSH | 66 | 1.10 | 2.71 | -0.80 | -0.37 | - | -0.18 | -1.34 | -0.33 | |
| 2022-23 | NSH | 79 | -1.01 | -0.79 | -0.85 | -0.98 | - | -0.89 | -1.17 | -0.22 | |
| 2023-24 | NSH | 56 | -0.26 | -0.84 | 0.43 | 0.33 | - | 1.24 | -1.21 | -0.43 | |
| 2024-25 | CBJ, NSH | 68 | 0.61 | 0.11 | 0.92 | 2.90 | - | -0.68 | -1.23 | 0.61 | |
| 2025-26 | CBJ | 74 | -0.75 | -1.11 | 0.27 | 0.97 | - | -0.70 | -0.98 | -0.46 |
Situational and Secondary Archetypes
| Season | Team(s) | GP | TOI | 5v5 TOI | 5v4 TOI | 4v5 TOI | Possession | Drive | Suppress | Faceoffs |
|---|---|---|---|---|---|---|---|---|---|---|
| 2018-19 | NSH | 4 | -2.50 | -1.74 | -2.03 | 0.15 | -3.84 | 3.93 | - | |
| 2019-20 | NSH | 64 | 0.84 | -1.45 | -1.65 | -0.29 | -1.26 | 0.83 | - | |
| 2020-21 | NSH | 40 | 0.40 | -1.25 | -0.64 | 0.43 | 0.95 | -0.31 | - | |
| 2021-22 | NSH | 66 | 0.64 | -1.41 | -1.16 | 0.79 | 1.34 | -0.24 | - | |
| 2022-23 | NSH | 79 | -0.45 | -1.16 | -0.24 | 0.61 | 0.17 | 0.87 | - | |
| 2023-24 | NSH | 56 | -0.69 | -1.39 | -0.68 | -0.37 | 0.14 | -0.70 | - | |
| 2024-25 | CBJ, NSH | 68 | 1.02 | -1.40 | -0.12 | 1.44 | 1.75 | 0.30 | - | |
| 2025-26 | CBJ | 74 | -1.05 | -1.47 | -0.11 | -1.39 | -1.39 | -0.79 | - |
5v5 Individual Stats
| Season | Team(s) | GP | TOI | G/60 | A/60 | Pts/60 | xG/60 | GAE/60 | Sh% | xSh% | Sh%AE | %SA Rush | %SA Reb. |
|---|---|---|---|---|---|---|---|---|---|---|---|---|---|
| 2018-19 | NSH | 4 | 48:48 | 1.23 | 0.00 | 1.23 | 0.07 | 1.16 | 20.00 | 1.09 | 18.91 | 0.00 | 0.00 |
| 2019-20 | NSH | 64 | 1099:24 | 0.16 | 0.33 | 0.49 | 0.13 | 0.03 | 3.45 | 2.75 | 0.70 | 0.81 | 1.61 |
| 2020-21 | NSH | 40 | 664:10 | 0.09 | 0.72 | 0.81 | 0.10 | -0.01 | 1.85 | 2.10 | -0.25 | 1.49 | 2.99 |
| 2021-22 | NSH | 66 | 1115:29 | 0.11 | 1.13 | 1.24 | 0.16 | -0.05 | 2.47 | 3.60 | -1.13 | 0.84 | 1.68 |
| 2022-23 | NSH | 79 | 1178:44 | 0.05 | 0.41 | 0.46 | 0.17 | -0.12 | 1.08 | 3.68 | -2.60 | 0.00 | 2.48 |
| 2023-24 | NSH | 56 | 805:57 | 0.22 | 0.67 | 0.89 | 0.17 | 0.05 | 5.00 | 3.81 | 1.19 | 2.33 | 1.16 |
| 2024-25 | CBJ | 62 | 1195:27 | 0.40 | 0.80 | 1.20 | 0.12 | 0.28 | 10.67 | 3.22 | 7.45 | 0.00 | 1.71 |
| 2024-25 | NSH | 6 | 73:49 | 0.00 | 0.00 | 0.00 | 0.15 | -0.15 | 0.00 | 2.58 | -2.58 | 0.00 | 0.00 |
| 2024-25 | CBJ, NSH | 68 | 1269:16 | 0.38 | 0.76 | 1.13 | 0.12 | 0.26 | 9.76 | 3.16 | 6.59 | 0.00 | 1.59 |
| 2025-26 | CBJ | 74 | 1068:20 | 0.22 | 0.34 | 0.56 | 0.11 | 0.11 | 6.45 | 3.22 | 3.23 | 0.00 | 1.08 |
5v5 On Ice Stats
| Season | Team(s) | GP | TOI | SAF/60 | GF/60 | xGF/60 | SAA/60 | GA/60 | xGA/60 | GF% | xGF% | xGF Rel | xGA Rel | xGF% Rel |
|---|---|---|---|---|---|---|---|---|---|---|---|---|---|---|
| 2018-19 | NSH | 4 | 48:48 | 38.11 | 1.23 | 2.14 | 31.97 | 2.46 | 1.97 | 33.33 | 52.09 | -0.49 | -0.36 | -0.94 |
| 2019-20 | NSH | 64 | 1099:24 | 42.40 | 2.24 | 2.12 | 40.33 | 2.51 | 2.43 | 47.13 | 46.67 | -0.54 | -0.02 | -5.41 |
| 2020-21 | NSH | 40 | 664:10 | 44.27 | 1.90 | 2.28 | 40.38 | 1.90 | 2.25 | 50.00 | 50.33 | 0.10 | 0.04 | 0.68 |
| 2021-22 | NSH | 66 | 1115:29 | 44.75 | 3.01 | 2.63 | 40.93 | 2.47 | 2.38 | 54.90 | 52.54 | 0.38 | 0.05 | 3.40 |
| 2022-23 | NSH | 79 | 1178:44 | 40.42 | 1.83 | 2.48 | 42.96 | 2.29 | 2.67 | 44.44 | 48.10 | -0.11 | -0.23 | 0.99 |
| 2023-24 | NSH | 56 | 805:57 | 44.82 | 2.83 | 2.77 | 41.91 | 2.46 | 2.39 | 53.52 | 53.68 | 0.28 | 0.06 | 2.03 |
| 2024-25 | CBJ | 62 | 1195:27 | 44.47 | 3.11 | 2.57 | 41.26 | 2.31 | 2.42 | 57.41 | 51.53 | 0.35 | -0.20 | 5.59 |
| 2024-25 | NSH | 6 | 73:49 | 56.08 | 1.63 | 3.22 | 49.58 | 4.06 | 2.97 | 28.57 | 52.01 | 1.46 | 0.62 | 9.17 |
| 2024-25 | CBJ, NSH | 68 | 1269:16 | 45.14 | 3.03 | 2.61 | 41.74 | 2.41 | 2.45 | 55.65 | 51.56 | 0.43 | -0.14 | 5.88 |
| 2025-26 | CBJ | 74 | 1068:20 | 38.25 | 1.63 | 2.37 | 43.24 | 2.58 | 2.62 | 38.67 | 47.42 | -0.55 | 0.06 | -5.82 |
NHL Edge Stats
| Skating | Shooting | Zone Time | |||||||||||
|---|---|---|---|---|---|---|---|---|---|---|---|---|---|
| Season | GP | Top Speed | Bursts>20/mi | Avg. Speed | Top Speed | Avg. Speed | %Long Range | %Mid Range | %High Danger | ES DZ% | ES NZ% | ES OZ% | |
| This table is for Basic and Premium subscribers only. To view please login to and/or subscribe to one of our subscription plans. | |||||||||||||
Legend
| Percentile 0-25 | Percentile 25-50 | Percentile 50-75 | Percentile 75-100 |
5v5 Defense Pairs
| Season | Teammate | Team | TOI | GF/60 | GA/60 | GF% | xGF/60 | xGA/60 | xGF% | xGF Rel | xGA Rel | xGF% Rel |
|---|
Glossary
| Type | Statistic | Definition |
|---|---|---|
| Individual | G/60 | Goals Against per 60 minutes. |
| Individual | A/60 | Assists per 60 minutes. |
| Individual | Pts/60 | Points per 60 minutes. |
| Individual | xG/60 | Expected Goals per 60 minutes. |
| Individual | GAE/60 | Goals Above Expected (G/60 - xG/60). |
| Individual | Sh% | Shooting Percentage. |
| Individual | xSh% | Expected Shooting Percentage. |
| Individual | Sh%AE | Shooting percentage above expected (Sh% - xSh%). |
| Individual | %SA Rush | Percentage of shot attempts determined to be on the rush. |
| Individual | %SA Reb. | Percentage of shot attempts determined to be from rebounds. |
| On Ice | SAF/60 | Shot Attempts For per 60 minutes. |
| On Ice | GF/60 | Goals For per 60 minutes. |
| On Ice | xGF/60 | Expected Goals For per 60 minutes. |
| On Ice | SAA/60 | Shot Attempts Against per 60 minutes (lower is better). |
| On Ice | GA/60 | Goals Against per 60 minutes (lower is better). |
| On Ice | xGA/60 | Expected Goals Against per 60 minutes (lower is better). |
| On Ice | GF% | Goals For Percentage = Goals For / (Goals For + Goals Against) |
| On Ice | xGF% | Expected Goals For Percentage = Expected Goals For / (Expected Goals For + Expected Goals Against) |
| On Ice | xGF Rel | xGF/60 when On Ice - xGF/60 when not On Ice. |
| On Ice | xGA Rel | xGA/60 when On Ice - xGA/60 when not On Ice (lower is better). |
| On Ice | xGF% Rel | xGF% when On Ice - xGF% when not On Ice. |
News and Opinions
-
Blue Jackets 2025-26 player review, Dante Fabbro saw his role diminish at Union Blue (Wed Jun 3, 2026)
-
CBJ 3, NJ 0: Blue Jackets Extend Winning Streak With Shutout Of Devils; Fabbro, Olivier Lead Offense at 1st Ohio Battery (Tue Feb 3, 2026)
-
Blue Jackets Resume Play Looking to Make This Season Matter at The Hockey Writers (Sun Dec 28, 2025)
-
Blue Jackets 2025-26 season preview, Dante Fabbro found a home at Union Blue (Thu Sep 4, 2025)
-
Blue Jackets Hoping On (Needing) More Of The Same From Internal Core As They March Forward at 1st Ohio Battery (Mon Jul 14, 2025)
-
Kiss your dreams goodbye on a Nashville Predators reunion with Dante Fabbro at Pred Lines (Sun Jun 29, 2025)
-
New Dante Fabbro contract extension makes sense for both him and the Blue Jackets at Union Blue (Sun Jun 29, 2025)
-
Dante Fabbro's season in review, he revitalized his career in Columbus at Union Blue (Wed May 7, 2025)
Current Contract
Dante Fabbro signed a $16,500,000 4-year contract with the Columbus Blue Jackets and General Manager Don Waddell on June 29, 2025 with an AAV of $4,125,000. This contract will start in 2025-26 and end after the 2028-29 season. In the first season of the contract the cap hit was equivalent to 4.32% of the salary cap.
Standard Contract (UFA) ( ) (0 ratings)
Dante Fabbro signed a $2,500,000 1-year contract with the Nashville Predators and General Manager Barry Trotz on March 8, 2024 with an AAV of $2,500,000. This contract will start in 2024-25 and end after the 2024-25 season. In the first season of the contract the cap hit was equivalent to 2.84% of the salary cap.
Standard Contract (RFA) ( ) (0 ratings)
| Season | Age* | Clause | Cap Hit | AAV | Perf. Bonus | Sign. Bonus | Salary | Compensation | Minors Salary | Status | |
|---|---|---|---|---|---|---|---|---|---|---|---|
| 2024-25 | 26 | $2,500,000 | $2,500,000 | - | - | $2,500,000 | $2,500,000 | $2,500,000 | RFA-arb | ||
| Total | - | - | $2,500,000 | $2,500,000 | $2,500,000 |
Dante Fabbro signed a $2,500,000 1-year contract with the Nashville Predators and General Manager David Poile on March 3, 2023 with an AAV of $2,500,000. This contract will start in 2023-24 and end after the 2023-24 season. In the first season of the contract the cap hit was equivalent to 2.99% of the salary cap.
Standard Contract (RFA) ( ) (0 ratings)
| Season | Age* | Clause | Cap Hit | AAV | Perf. Bonus | Sign. Bonus | Salary | Compensation | Minors Salary | Status | |
|---|---|---|---|---|---|---|---|---|---|---|---|
| 2023-24 | 25 | $2,500,000 | $2,500,000 | - | - | $2,500,000 | $2,500,000 | $2,500,000 | RFA-arb | ||
| Total | - | - | $2,500,000 | $2,500,000 | $2,500,000 |
Dante Fabbro signed a $4,800,000 2-year contract with the Nashville Predators and General Manager David Poile on August 5, 2021 with an AAV of $2,400,000. This contract will start in 2021-22 and end after the 2022-23 season. In the first season of the contract the cap hit was equivalent to 2.94% of the salary cap.
Standard Contract (RFA) ( ) (0 ratings)
| Season | Age* | Clause | Cap Hit | AAV | Perf. Bonus | Sign. Bonus | Salary | Compensation | Minors Salary | Status | |
|---|---|---|---|---|---|---|---|---|---|---|---|
| 2021-22 | 23 | $2,400,000 | $2,400,000 | - | - | $2,400,000 | $2,400,000 | $2,400,000 | RFA-arb | ||
| 2022-23 | 24 | $2,400,000 | $2,400,000 | - | - | $2,400,000 | $2,400,000 | $2,400,000 | RFA-arb | ||
| Total | - | - | $4,800,000 | $4,800,000 | $4,800,000 |
Dante Fabbro signed a $2,775,000 3-year contract with the Nashville Predators and General Manager David Poile on March 27, 2019 with an AAV of $925,000. This contract will start in 2018-19 and end after the 2020-21 season. In the first season of the contract the cap hit was equivalent to 1.16% of the salary cap.
Entry Level Contract ( ) (0 ratings)
| Season | Age* | Clause | Cap Hit | AAV | Perf. Bonus | Sign. Bonus | Salary | Compensation | Minors Salary | Status | |
|---|---|---|---|---|---|---|---|---|---|---|---|
| 2018-19 | 20 | $925,000 | $1,491,667 | - | $92,500 | $832,500 | $925,000 | $70,000 | ELC | ||
| 2019-20 | 21 | $925,000 | $1,491,667 | $850,000 | $92,500 | $832,500 | $925,000 | $70,000 | ELC | ||
| 2020-21 | 22 | $925,000 | $1,491,667 | $850,000 | $92,500 | $832,500 | $925,000 | $70,000 | ELC | ||
| Total | $1,700,000 | $277,500 | $2,497,500 | $2,775,000 | $210,000 |
Career Statistics
| Regular Season | Playoffs | |||||||||||||||||||
|---|---|---|---|---|---|---|---|---|---|---|---|---|---|---|---|---|---|---|---|---|
| Season | League | Team | GP | G | A | Pts | +/- | PIM | Shots | Sh% | TOI/G | GP | G | A | Pts | +/- | PIM | Shots | Sh% | TOI/G |
| 2009-10 | QC Int PW | Burnaby Winter Club Bruins | 7 | 0 | 4 | 4 | ||||||||||||||
| 2010-11 | QC Int PW | Burnaby Winter Club Bruins | 3 | 0 | 1 | 1 | ||||||||||||||
| 2010-11 | QC Int PW | Burnaby Winter Club Peewee | 3 | 1 | 1 | |||||||||||||||
| 2011-12 | John Reid Bantam | Burnaby Winter Club Bntm A1-T1 | 6 | 3 | 2 | 5 | 4 | |||||||||||||
| 2012-13 | PCBHL | Burnaby Winter Club U15 A1 | 58 | 25 | 53 | 78 | 48 | |||||||||||||
| 2012-13 | U16 Cup | BCMML Avalanche | 4 | 2 | 2 | 2 | ||||||||||||||
| 2013-14 | BCHL | Langley | 2 | 0 | 0 | 0 | ||||||||||||||
| 2013-14 | BCMML | Van. NW Giants | 38 | 22 | 39 | 61 | 44 | 6 | 2 | 8 | 10 | 12 | ||||||||
| 2014-15 | BCHL | Penticton | 44 | 4 | 29 | 33 | 16 | 21 | 4 | 11 | 15 | 10 | ||||||||
| 2014-15 | RB-Cup | Penticton | 5 | 3 | 3 | |||||||||||||||
| 2015-16 | WJC-18 | Canada U18 | 7 | 0 | 8 | 8 | +5 | 16 | ||||||||||||
| 2015-16 | WJAC-19 | Canada West U19 | 4 | 0 | 3 | 3 | 4 | |||||||||||||
| 2015-16 | Hlinka Gretzky Cup | Canada U18 | 4 | 0 | 0 | 0 | +2 | |||||||||||||
| 2015-16 | U18-Dev | Team Red | 3 | 1 | 1 | 2 | ||||||||||||||
| 2015-16 | BCHL | Penticton | 45 | 14 | 53 | 67 | 30 | 11 | 8 | 8 | 2 | |||||||||
| 2015-16 | BCHL | Penticton Vees | 45 | 14 | 53 | 67 | 30 | 11 | 8 | 8 | 2 | |||||||||
| 2016-17 | NCAA | Boston Univ. | 36 | 6 | 12 | 18 | +6 | 16 | ||||||||||||
| 2016-17 | WJC-20 | Canada U20 | 7 | 0 | 1 | 1 | +3 | |||||||||||||
| 2017-18 | NCAA | Boston Univ. | 38 | 9 | 20 | 29 | +4 | 22 | ||||||||||||
| 2017-18 | WJC-20 | Canada U20 | 7 | 0 | 0 | 0 | +1 | |||||||||||||
| 2018-19 | NCAA | Boston Univ. | 38 | 7 | 26 | 33 | -3 | 39 | ||||||||||||
| 2018-19 | WC | Canada | 9 | 1 | 2 | 3 | +10 | |||||||||||||
| 2018-19 | Spengler Cup | Team Canada | 4 | 2 | 1 | 3 | +3 | |||||||||||||
| 2018-19 | NHL | Nashville Predators | 4 | 1 | 0 | 1 | -1 | 5 | 20.0 | 12:44 | 6 | 1 | 1 | +2 | 3 | 0.0 | 12:05 | |||
| 2019-20 | NHL | Nashville Predators | 64 | 5 | 6 | 11 | -7 | 38 | 92 | 5.4 | 19:02 | 4 | -1 | 2 | 2 | 0.0 | 20:35 | |||
| 2020-21 | NHL | Nashville Predators | 40 | 2 | 10 | 12 | -1 | 23 | 59 | 3.4 | 19:19 | |||||||||
| 2021-22 | NHL | Nashville Predators | 66 | 3 | 21 | 24 | +13 | 24 | 88 | 3.4 | 19:03 | 4 | -4 | 4 | 4 | 0.0 | 19:40 | |||
| 2022-23 | NHL | Nashville Predators | 79 | 2 | 9 | 11 | -4 | 50 | 101 | 2.0 | 17:27 | |||||||||
| 2023-24 | NHL | Nashville Predators | 56 | 3 | 10 | 13 | +9 | 24 | 65 | 4.6 | 16:21 | 3 | 1 | 0.0 | 13:25 | |||||
| 2024-25 | NHL | Columbus Blue Jackets | 62 | 9 | 17 | 26 | +23 | 40 | 82 | 11.0 | 21:39 | |||||||||
| 2024-25 | NHL | Nashville Predators | 6 | 0 | 0 | 0 | -3 | 7 | 0.0 | 13:06 | ||||||||||
| 2025-26 | NHL | Columbus Blue Jackets | 74 | 5 | 6 | 11 | -16 | 33 | 68 | 7.4 | 16:34 | |||||||||
| NHL Career | 451 | 30 | 79 | 109 | +13 | 232 | 567 | 5.3 | 18:16 | 17 | 1 | 1 | -3 | 6 | 10 | 0.0 | 16:06 | |||