
 Anton Lundell
| Position | Center / Left Wing | Current Team | Florida Panthers |
| Shoots | Left | Current Contract | 6 years ($5.0M CapHit) |
| Height | 6'1" | Expires | 2029-30 |
| Weight (lbs) | 196 | Expiry Age (Jun 30) | 28 |
| Age (DOB) | 24 (Oct 3, 2001) | Expiry Status | UFA |
| Drafted | 2020, Round 1, Overall 12 (FLA) |
| Date | Team | Transaction | |
|---|---|---|---|
| Jul 3, 2024 | Florida Panthers | Signed 6 years @ $5.000M AAV starting in 2024-25 | |
| Jun 7, 2021 | Florida Panthers | Signed to an entry level contract. |
Player Card(s)
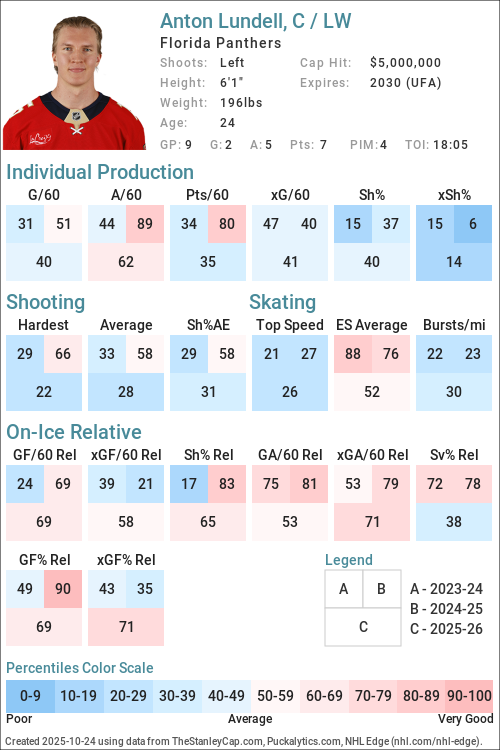
URL: https://thestanleycap.com/cdn/player_cards/20252026/anton-lundell-8482113.png
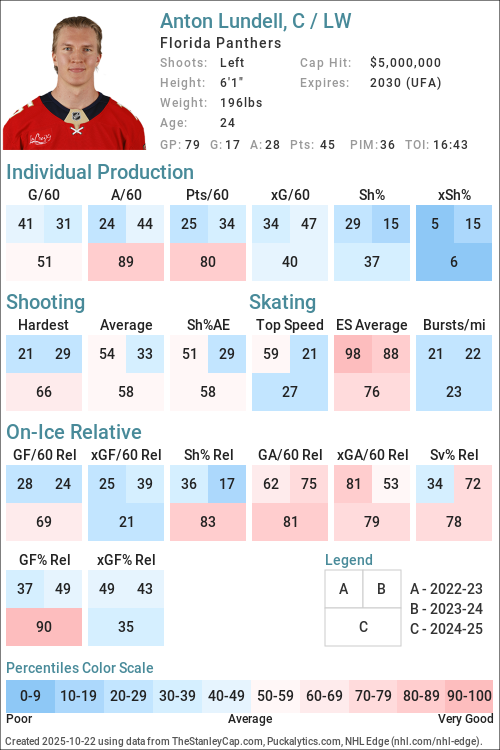
URL: https://thestanleycap.com/cdn/player_cards/20242025/anton-lundell-8482113.png
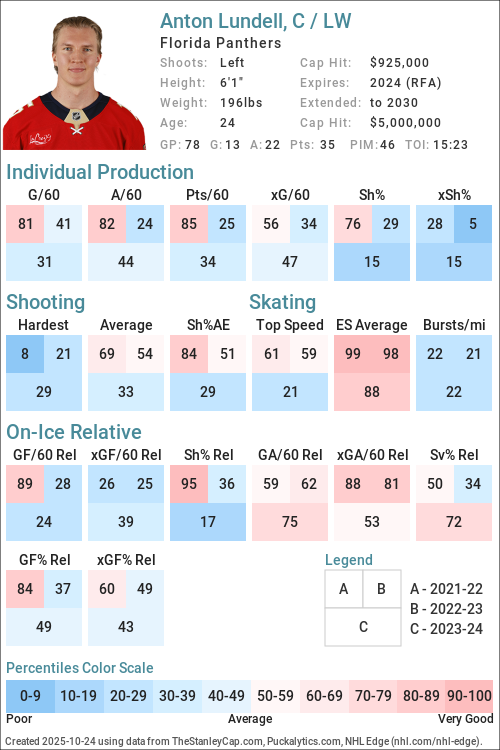
URL: https://thestanleycap.com/cdn/player_cards/20232024/anton-lundell-8482113.png
About Player Cards
Player cards present an infographic of a players performance using a series of Player Archetypes developed for Puckalytics.com and TheStanleyCap.com. The boxes in the rink image show the archetype ratings for the season specified in the card while the graphs to the right show the five-year trends for those archetypes.
Except for Faceoffs, the values shown are the players z-score (standard deviation from the mean) for the specific metric used to calculate the archetype values. When calculating z-scores forwards were compared to forwards and defensemen were compared to defensemen. Positive values indicate the player is above average and shaded in blue, while negative values indicate the player is below average and shaded in pink. The five year trend charts show a range of -4.0 to 4.0.
The value shown for Faceoffs is the faceoff winning percentage rather than their z-score with winning percentages below 50 in pink shades and above 50 in blue shades.
All archetypes are 5v5 except 5v4 TOI, 4v5 TOI, Skating (even strength) and Faceoffs (all situations). Archetypes use regular season data only.
Archetypes Summary
- Sniper - Measures the to score above the expected goal rate.
- Rebound - Measures the percent of a players shot attempts that come from rebounds (forwards only).
- 5v4 TOI - Powerplay ice time, calculated as the percentage of his teams 5v4 ice time that the player was on the ice for.
- Shooter - Measures whether a players points come from shots (goals or assists on rebounds from his shots).
- Producer - Measures a players ability to produce goals and assists, adjusted for quality of teammates.
- Playmaker - Measures whether a players points come from passes.
- Drive - Measures a players ability to drive puck possession and generate shot attempts for his team.
- Rush - Measures the percent of a players shot attempts that come from rush plays
- Possession - An indicator of a players ability to improve his teams puck possession game.
- Faceoffs - Faceoff Winning Percentage (min. 75 faceoffs taken).
- 5v5 TOI - The percentage of his teams 5v5 TOI that the player was on the ice for.
- Suppress - Measures a players ability to suppress opponent puck possession and shot attempts against.
- Skating - An indicator of a players skating ability, or speed bursts above 20mph per mile skated.
- Defend - An indicator of a players ability to suppress shot quality against.
- 4v5 TOI - Penalty Kill ice time, calculated as the percentage of his teams 4v5 ice time that the player was on the ice for.
Data Sources
- Salary data is from TheStanleyCap.com
- Skating data is from NHL Edge
- Other statistics are from Puckalytics.com and derived from data from NHL.com
Terms of Use
You are free to use include player cards in written articles, share on social media, or on other public websites under the following conditions:
- You credit TheStanleyCap.com as the source and provide a link back to TheStanleyCap.com or this player page.
- You do not mass copy/duplicate/publish dozens or hundreds of player cards. A few, or a handful for a written article is fine. Be reasonable. Fair use rules apply.
- If you are a high-traffic website you must download and host the image(s) on your site rather than overload TheStanleyCap servers with traffic.
Note: Player cards will update daily throughout the season so if you want to include snapshot then you must download the image.
If you have any questions, send an e-mail to the e-mail address at the top of this page.
Read Introducing Player Archetypes on HockeyAnalysis.com for more details on archetype calculations.
Core Archetypes
| Season | Team(s) | GP | TOI | Producer | Playmaker | Shooter | Sniper | Rebound | Rush | Skating | Defend |
|---|---|---|---|---|---|---|---|---|---|---|---|
| 2021-22 | FLA | 65 | 0.18 | -0.03 | 0.14 | 0.69 | 0.18 | 0.59 | -0.73 | -0.02 | |
| 2022-23 | FLA | 73 | -1.05 | -1.06 | -0.41 | 0.12 | -1.19 | -0.15 | -0.75 | -0.39 | |
| 2023-24 | FLA | 78 | -0.35 | 0.04 | -0.60 | -0.67 | 0.92 | -0.70 | -0.74 | 0.59 | |
| 2024-25 | FLA | 79 | 1.11 | 1.04 | 0.14 | 0.18 | 0.49 | -0.06 | -0.79 | 0.81 | |
| 2025-26 | FLA | 64 | -0.31 | -0.85 | 0.40 | 0.21 | -1.02 | -0.80 | -0.85 | 0.76 |
Situational and Secondary Archetypes
| Season | Team(s) | GP | TOI | 5v5 TOI | 5v4 TOI | 4v5 TOI | Possession | Drive | Suppress | Faceoffs |
|---|---|---|---|---|---|---|---|---|---|---|
| 2021-22 | FLA | 65 | 0.03 | -1.35 | 1.32 | -0.08 | -0.72 | 0.74 | 44.7 | |
| 2022-23 | FLA | 73 | 0.17 | -0.54 | 0.56 | 0.31 | -0.37 | 0.97 | 46.5 | |
| 2023-24 | FLA | 78 | 0.33 | -0.86 | -0.48 | 0.21 | 0.22 | 0.02 | 54.9 | |
| 2024-25 | FLA | 79 | 0.16 | -0.66 | 0.97 | -0.38 | -0.88 | 0.47 | 53.0 | |
| 2025-26 | FLA | 64 | 0.77 | 0.14 | 0.68 | -0.35 | -0.16 | -0.36 | 51.8 |
5v5 Individual Stats
| Season | Team(s) | GP | TOI | G/60 | A/60 | Pts/60 | xG/60 | GAE/60 | Sh% | xSh% | Sh%AE | %SA Rush | %SA Reb. |
|---|---|---|---|---|---|---|---|---|---|---|---|---|---|
| 2021-22 | FLA | 65 | 780:03 | 1.00 | 1.31 | 2.31 | 0.81 | 0.19 | 12.75 | 10.34 | 2.41 | 5.19 | 6.67 |
| 2022-23 | FLA | 73 | 869:02 | 0.62 | 0.69 | 1.31 | 0.63 | -0.01 | 7.96 | 8.08 | -0.12 | 3.47 | 3.47 |
| 2023-24 | FLA | 78 | 950:34 | 0.50 | 0.88 | 1.39 | 0.70 | -0.19 | 6.45 | 8.91 | -2.46 | 2.41 | 10.84 |
| 2024-25 | FLA | 79 | 983:52 | 0.67 | 1.34 | 2.01 | 0.63 | 0.04 | 9.32 | 8.76 | 0.56 | 2.34 | 8.77 |
| 2025-26 | FLA | 64 | 834:58 | 0.79 | 0.72 | 1.51 | 0.78 | 0.01 | 11.83 | 11.64 | 0.19 | 1.39 | 4.86 |
5v5 On Ice Stats
| Season | Team(s) | GP | TOI | SAF/60 | GF/60 | xGF/60 | SAA/60 | GA/60 | xGA/60 | GF% | xGF% | xGF Rel | xGA Rel | xGF% Rel |
|---|---|---|---|---|---|---|---|---|---|---|---|---|---|---|
| 2021-22 | FLA | 65 | 780:03 | 46.61 | 4.31 | 3.22 | 37.00 | 2.31 | 2.28 | 65.12 | 58.59 | -0.21 | -0.34 | 1.80 |
| 2022-23 | FLA | 73 | 869:02 | 47.64 | 2.69 | 2.90 | 39.77 | 2.42 | 2.51 | 52.70 | 53.60 | -0.35 | -0.24 | -0.58 |
| 2023-24 | FLA | 78 | 950:34 | 45.89 | 2.08 | 2.50 | 39.20 | 1.51 | 2.22 | 57.89 | 52.93 | -0.11 | 0.04 | -1.48 |
| 2024-25 | FLA | 79 | 983:52 | 42.51 | 2.62 | 2.39 | 36.90 | 1.77 | 2.10 | 59.72 | 53.20 | -0.34 | -0.09 | -2.28 |
| 2025-26 | FLA | 64 | 834:58 | 41.68 | 2.44 | 2.55 | 40.38 | 2.52 | 2.44 | 49.28 | 51.14 | -0.15 | -0.05 | -0.87 |
NHL Edge Stats
| Skating | Shooting | Zone Time | |||||||||||
|---|---|---|---|---|---|---|---|---|---|---|---|---|---|
| Season | GP | Top Speed | Bursts>20/mi | Avg. Speed | Top Speed | Avg. Speed | %Long Range | %Mid Range | %High Danger | ES DZ% | ES NZ% | ES OZ% | |
| This table is for Basic and Premium subscribers only. To view please login to and/or subscribe to one of our subscription plans. | |||||||||||||
Legend
| Percentile 0-25 | Percentile 25-50 | Percentile 50-75 | Percentile 75-100 |
5v5 Lines
| Season | Teammate | Teammate | Team | TOI | GF/60 | GA/60 | GF% | xGF/60 | xGA/60 | xGF% | xGF Rel | xGA Rel | xGF% Rel |
|---|
Glossary
| Type | Statistic | Definition |
|---|---|---|
| Individual | G/60 | Goals Against per 60 minutes. |
| Individual | A/60 | Assists per 60 minutes. |
| Individual | Pts/60 | Points per 60 minutes. |
| Individual | xG/60 | Expected Goals per 60 minutes. |
| Individual | GAE/60 | Goals Above Expected (G/60 - xG/60). |
| Individual | Sh% | Shooting Percentage. |
| Individual | xSh% | Expected Shooting Percentage. |
| Individual | Sh%AE | Shooting percentage above expected (Sh% - xSh%). |
| Individual | %SA Rush | Percentage of shot attempts determined to be on the rush. |
| Individual | %SA Reb. | Percentage of shot attempts determined to be from rebounds. |
| On Ice | SAF/60 | Shot Attempts For per 60 minutes. |
| On Ice | GF/60 | Goals For per 60 minutes. |
| On Ice | xGF/60 | Expected Goals For per 60 minutes. |
| On Ice | SAA/60 | Shot Attempts Against per 60 minutes (lower is better). |
| On Ice | GA/60 | Goals Against per 60 minutes (lower is better). |
| On Ice | xGA/60 | Expected Goals Against per 60 minutes (lower is better). |
| On Ice | GF% | Goals For Percentage = Goals For / (Goals For + Goals Against) |
| On Ice | xGF% | Expected Goals For Percentage = Expected Goals For / (Expected Goals For + Expected Goals Against) |
| On Ice | xGF Rel | xGF/60 when On Ice - xGF/60 when not On Ice. |
| On Ice | xGA Rel | xGA/60 when On Ice - xGA/60 when not On Ice (lower is better). |
| On Ice | xGF% Rel | xGF% when On Ice - xGF% when not On Ice. |
News and Opinions
-
3 NHL Stars Comparable to Canucks’ Caleb Malhotra at The Hockey Writers (Mon Jul 13, 2026)
-
Barkov and Lundell win gold at Worlds at Litter Box Cats (Mon Jun 1, 2026)
-
Olympics: Lundell scores in Finland’s win over Sweden at Litter Box Cats (Sat Feb 14, 2026)
-
NHL Morning Recap – February 5, 2026 at The Hockey Writers (Thu Feb 5, 2026)
-
Sam Bennett To Play Against Bruins, Anton Lundell Probable, Brad Marchand Remains Out at Yahoo Sports NHL (Wed Feb 4, 2026)
-
Panthers’ Anton Lundell Stepping up to Fill Some Big Shoes This Season at The Hockey Writers (Wed Jan 14, 2026)
-
Panthers' Anton Lundell Fined For High-Stick Infraction Against Canadiens at Yahoo Sports NHL (Fri Jan 9, 2026)
-
Panthers' Anton Lundell punished for high-sticking Canadiens' Alexandre Texier at Habs Fanatics (Fri Jan 9, 2026)
-
Trio Of Panthers Players Named To Team Finland's Olympic Roster at Yahoo Sports NHL (Fri Jan 2, 2026)
-
Panthers' Anton Lundell Slapped With A Fine; Lightning's Scott Sabourin As Well at Yahoo Sports NHL (Mon Dec 29, 2025)
-
Three takeaways: Panthers never stopped believing, plays by Lundell and Marchand fuel epic comeback at Yahoo Sports NHL (Sat Dec 20, 2025)
-
Lundell lifts Panthers to 4-3 win over Mammoth at Litter Box Cats (Thu Dec 11, 2025)
-
Marchand, Lundell score as Panthers clip Flyers 2-1 at Yahoo Sports NHL (Thu Oct 9, 2025)
-
Anton Lundell Will Be a Major Factor for the Florida Panthers This Season at NHL Rumors (Tue Oct 7, 2025)
-
Panthers' Anton Lundell Exits Game With Upper-Body Injury; To Be Evaluated Further at Yahoo Sports NHL (Fri Oct 3, 2025)
-
NHL Nugget: Panthers' Seth Jones And Anton Lundell's Birthday Backcheck at The Hockey News (Fri Oct 3, 2025)
-
'If We Were To Lose That Game, It Could've Been Different': Panthers' Anton Lundell Talks About The Turning Point In Series Win Over The Maple Leafs at Yahoo Sports NHL (Sun Aug 24, 2025)
-
'If We Were To Lose That Game, It Could've Been Different': Panthers' Anton Lundell Admits Game 3 Win Over Maple Leafs Changed Course Of Series at Yahoo Sports NHL (Sat Aug 23, 2025)
-
3 Florida Panthers Poised to Take the Next Step in 2025-26 at The Hockey Writers (Mon Jul 21, 2025)
-
Paul Maurice Should Make a Change On Power Play at The Rat Trick (Tue Jun 10, 2025)
-
Luostarinen, Lundell, Marchand: the Most Underrated Line In Hockey at The Rat Trick (Mon Jun 2, 2025)
-
How Good of a Drafter is Bill Zito- the 2020 Draft at The Puck Under the Sun (Mon Sep 30, 2024)
-
Devils Draft Series: Anton Lundell, Strong Two-Way Forward at Devils Army (Mon May 11, 2020)
Current Contract
Anton Lundell signed a $30,000,000 6-year contract with the Florida Panthers and General Manager Bill Zito on July 3, 2024 with an AAV of $5,000,000. This contract will start in 2024-25 and end after the 2029-30 season. In the first season of the contract the cap hit was equivalent to 5.68% of the salary cap.
Standard Contract (RFA) ( ) (0 ratings)
Anton Lundell signed a $2,775,000 3-year contract with the Florida Panthers and General Manager Bill Zito on June 7, 2021 with an AAV of $925,000. This contract will start in 2021-22 and end after the 2023-24 season. In the first season of the contract the cap hit was equivalent to 1.13% of the salary cap.
Entry Level Contract ( ) (0 ratings)
| Season | Age* | Clause | Cap Hit | AAV | Perf. Bonus | Sign. Bonus | Salary | Compensation | Minors Salary | Status | |
|---|---|---|---|---|---|---|---|---|---|---|---|
| 2021-22 | 19 | $925,000 | $1,775,000 | $850,000 | $92,500 | $832,500 | $925,000 | $80,000 | ELC | ||
| 2022-23 | 20 | $925,000 | $1,775,000 | $850,000 | $92,500 | $832,500 | $925,000 | $80,000 | ELC | ||
| 2023-24 | 21 | $925,000 | $1,775,000 | $850,000 | $92,500 | $832,500 | $925,000 | $80,000 | ELC | ||
| Total | $2,550,000 | $277,500 | $2,497,500 | $2,775,000 | $240,000 |
Career Statistics
| Regular Season | Playoffs | |||||||||||||||||||
|---|---|---|---|---|---|---|---|---|---|---|---|---|---|---|---|---|---|---|---|---|
| Season | League | Team | GP | G | A | Pts | +/- | PIM | Shots | Sh% | TOI/G | GP | G | A | Pts | +/- | PIM | Shots | Sh% | TOI/G |
| 2015-16 | U16 SM-sarja | HIFK U16 | 27 | 4 | 11 | 15 | 10 | 5 | 1 | 1 | ||||||||||
| 2016-17 | U16 SM-sarja | HIFK U16 | 3 | 3 | 4 | 7 | ||||||||||||||
| 2016-17 | U18 SM-sarja | HIFK U18 | 29 | 3 | 12 | 15 | 10 | 2 | 1 | 1 | 2 | |||||||||
| 2017-18 | WJC-18 | Finland U18 | 7 | 2 | 4 | 6 | +1 | 2 | ||||||||||||
| 2017-18 | WHC-17 | Finland U17 | 5 | 3 | 4 | 7 | ||||||||||||||
| 2017-18 | U20 SM-liiga | HIFK U20 | 22 | 8 | 12 | 20 | +2 | 6 | 9 | 1 | 1 | 2 | -2 | 4 | ||||||
| 2017-18 | U18 SM-sarja | HIFK U18 | 10 | 3 | 7 | 10 | 22 | 5 | 1 | 4 | 5 | 8 | ||||||||
| 2018-19 | U20 SM-liiga | HIFK U20 | 10 | 6 | 9 | 15 | +11 | 6 | ||||||||||||
| 2018-19 | WJC-20 | Finland U20 | 7 | 1 | 3 | 4 | ||||||||||||||
| 2018-19 | WJC-18 | Finland U18 | 5 | 2 | 2 | 4 | +3 | 6 | ||||||||||||
| 2018-19 | Hlinka Gretzky Cup | Finland U18 | 4 | 1 | 1 | 2 | 16 | |||||||||||||
| 2018-19 | Champions HL | HIFK | 3 | 0 | 0 | 0 | +1 | 2 | ||||||||||||
| 2018-19 | Liiga | HIFK | 38 | 9 | 10 | 19 | +6 | 8 | 12 | -2 | 29 | |||||||||
| 2019-20 | Liiga | HIFK | 44 | 10 | 18 | 28 | +11 | 18 | ||||||||||||
| 2020-21 | WC | Finland | 10 | 4 | 3 | 7 | +7 | 4 | ||||||||||||
| 2020-21 | WJC-20 | Finland U20 | 7 | 6 | 4 | 10 | +7 | 4 | ||||||||||||
| 2020-21 | EHT | Finland | 5 | 1 | 1 | 2 | -1 | 4 | ||||||||||||
| 2020-21 | Liiga | HIFK | 26 | 16 | 9 | 25 | +9 | 12 | 8 | 1 | 2 | 3 | +1 | 4 | ||||||
| 2021-22 | NHL | Florida Panthers | 65 | 18 | 26 | 44 | +33 | 18 | 125 | 14.4 | 15:44 | 9 | 1 | 1 | -1 | 2 | 4 | 25.0 | 11:30 | |
| 2022-23 | NHL | Florida Panthers | 73 | 12 | 21 | 33 | +1 | 43 | 152 | 7.9 | 16:22 | 21 | 2 | 8 | 10 | +3 | 2 | 43 | 4.7 | 18:04 |
| 2023-24 | NHL | Florida Panthers | 78 | 13 | 22 | 35 | +19 | 46 | 166 | 7.8 | 15:23 | 24 | 3 | 14 | 17 | +8 | 12 | 29 | 10.3 | 16:12 |
| 2024-25 | 4 Nations | Finland | 3 | 1 | 0 | 1 | -2 | 8 | 12.0 | 13:33 | ||||||||||
| 2024-25 | NHL | Florida Panthers | 79 | 17 | 28 | 45 | +17 | 36 | 158 | 10.8 | 16:43 | 23 | 6 | 12 | 18 | +19 | 14 | 48 | 12.5 | 16:09 |
| 2025-26 | NHL | Florida Panthers | 64 | 18 | 26 | 44 | -8 | 34 | 138 | 13.0 | 19:09 | |||||||||
| 2025-26 | OG | Finland | 5 | 1 | 1 | 2 | +3 | 4 | 10 | 10.0 | 16:49 | |||||||||
| NHL Career | 359 | 78 | 123 | 201 | +62 | 177 | 739 | 10.6 | 16:37 | 77 | 12 | 34 | 46 | +29 | 30 | 124 | 9.7 | 16:09 | ||