
 Jonas Brodin
| Position | Left Defense / Right Defense | Current Team | Minnesota Wild |
| Shoots | Left | Current Contract | 7 years ($6.0M CapHit) |
| Height | 6'2" | Expires | 2027-28 |
| Weight (lbs) | 196 | Expiry Age (Jun 30) | 34 |
| Age (DOB) | 32 (July 12, 1993) | Expiry Status | UFA |
| Drafted | 2011, Round 1, Overall 10 (MIN) |
| Date | Team | Transaction | |
|---|---|---|---|
| Mar 3, 2026 | Minnesota Wild | Activated from IR | |
| Jan 15, 2026 | Minnesota Wild | Placed on IR | |
| Dec 20, 2025 | Minnesota Wild | Activated from IR | |
| Dec 17, 2025 | Minnesota Wild | Placed on IR | |
| Oct 6, 2025 | Minnesota Wild | Activated from IR | |
| Oct 6, 2025 | Minnesota Wild | Placed on IR | |
| Feb 4, 2025 | Minnesota Wild | Activated from LTIR | |
| Jan 28, 2025 | Minnesota Wild | Placed on LTIR | |
| Dec 14, 2024 | Minnesota Wild | Activated from IR | |
| Dec 3, 2024 | Minnesota Wild | Placed on IR | |
| Sep 15, 2020 | Minnesota Wild | Signed 7 years @ $6.000M AAV starting in 2021-22 | |
| Oct 13, 2014 | Minnesota Wild | Signed 6 years @ $4.167M AAV starting in 2015-16 | |
| Jul 13, 2011 | Minnesota Wild | Signed to an entry level contract. |
Player Card(s)
URL: https://thestanleycap.com/cdn/player_cards/20252026/jonas-brodin-8476463.png
URL: https://thestanleycap.com/cdn/player_cards/20242025/jonas-brodin-8476463.png
URL: https://thestanleycap.com/cdn/player_cards/20232024/jonas-brodin-8476463.png
About Player Cards
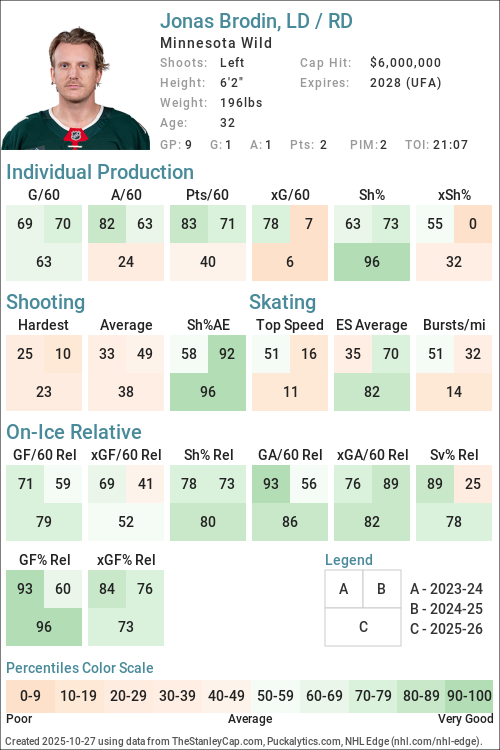
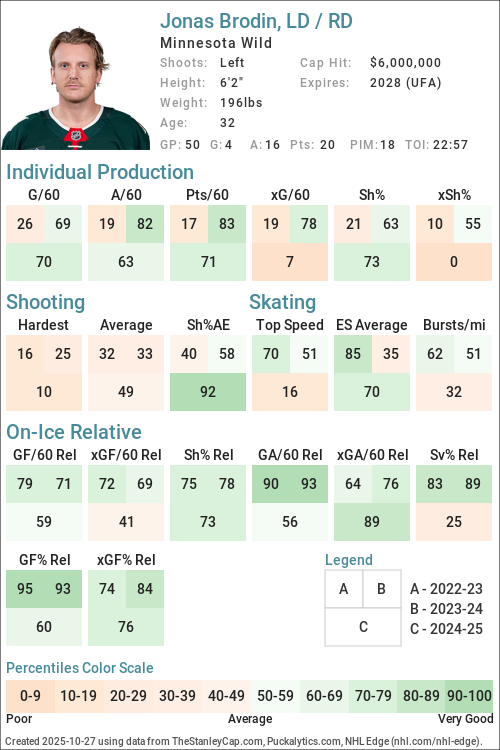
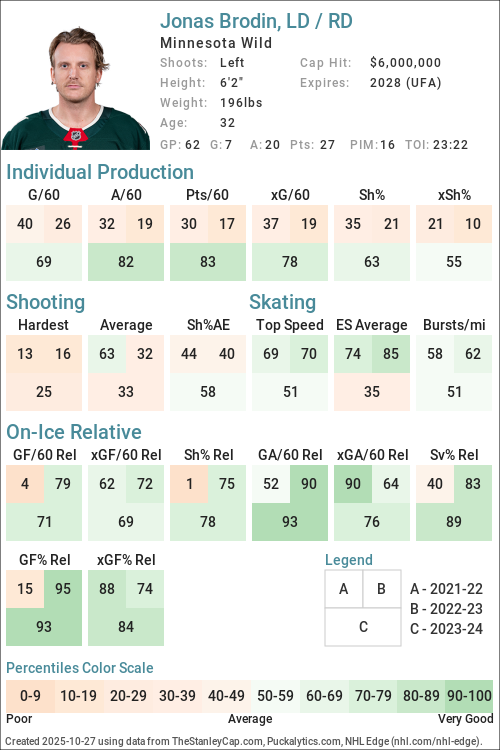
Player cards present an infographic of a players performance using a series of Player Archetypes developed for Puckalytics.com and TheStanleyCap.com. The boxes in the rink image show the archetype ratings for the season specified in the card while the graphs to the right show the five-year trends for those archetypes.
Except for Faceoffs, the values shown are the players z-score (standard deviation from the mean) for the specific metric used to calculate the archetype values. When calculating z-scores forwards were compared to forwards and defensemen were compared to defensemen. Positive values indicate the player is above average and shaded in blue, while negative values indicate the player is below average and shaded in pink. The five year trend charts show a range of -4.0 to 4.0.
The value shown for Faceoffs is the faceoff winning percentage rather than their z-score with winning percentages below 50 in pink shades and above 50 in blue shades.
All archetypes are 5v5 except 5v4 TOI, 4v5 TOI, Skating (even strength) and Faceoffs (all situations). Archetypes use regular season data only.
Archetypes Summary
- Sniper - Measures the to score above the expected goal rate.
- Rebound - Measures the percent of a players shot attempts that come from rebounds (forwards only).
- 5v4 TOI - Powerplay ice time, calculated as the percentage of his teams 5v4 ice time that the player was on the ice for.
- Shooter - Measures whether a players points come from shots (goals or assists on rebounds from his shots).
- Producer - Measures a players ability to produce goals and assists, adjusted for quality of teammates.
- Playmaker - Measures whether a players points come from passes.
- Drive - Measures a players ability to drive puck possession and generate shot attempts for his team.
- Rush - Measures the percent of a players shot attempts that come from rush plays
- Possession - An indicator of a players ability to improve his teams puck possession game.
- Faceoffs - Faceoff Winning Percentage (min. 75 faceoffs taken).
- 5v5 TOI - The percentage of his teams 5v5 TOI that the player was on the ice for.
- Suppress - Measures a players ability to suppress opponent puck possession and shot attempts against.
- Skating - An indicator of a players skating ability, or speed bursts above 20mph per mile skated.
- Defend - An indicator of a players ability to suppress shot quality against.
- 4v5 TOI - Penalty Kill ice time, calculated as the percentage of his teams 4v5 ice time that the player was on the ice for.
Data Sources
- Salary data is from TheStanleyCap.com
- Skating data is from NHL Edge
- Other statistics are from Puckalytics.com and derived from data from NHL.com
Terms of Use
You are free to use include player cards in written articles, share on social media, or on other public websites under the following conditions:
- You credit TheStanleyCap.com as the source and provide a link back to TheStanleyCap.com or this player page.
- You do not mass copy/duplicate/publish dozens or hundreds of player cards. A few, or a handful for a written article is fine. Be reasonable. Fair use rules apply.
- If you are a high-traffic website you must download and host the image(s) on your site rather than overload TheStanleyCap servers with traffic.
Note: Player cards will update daily throughout the season so if you want to include snapshot then you must download the image.
If you have any questions, send an e-mail to the e-mail address at the top of this page.
Read Introducing Player Archetypes on HockeyAnalysis.com for more details on archetype calculations.
Core Archetypes
| Season | Team(s) | GP | TOI | Producer | Playmaker | Shooter | Sniper | Rebound | Rush | Skating | Defend |
|---|---|---|---|---|---|---|---|---|---|---|---|
| 2015-16 | MIN | 68 | -1.06 | -1.18 | -0.44 | 0.10 | - | -0.89 | - | 0.88 | |
| 2016-17 | MIN | 68 | 0.46 | 2.32 | -0.77 | -1.66 | - | -0.96 | - | 0.01 | |
| 2017-18 | MIN | 73 | -0.50 | -0.78 | 0.26 | 2.56 | - | 0.97 | - | 0.10 | |
| 2018-19 | MIN | 82 | -0.37 | -0.47 | -0.25 | 0.00 | - | -1.03 | - | -0.07 | |
| 2019-20 | MIN | 69 | 0.63 | 1.44 | -0.62 | -0.59 | - | 0.61 | - | 0.13 | |
| 2020-21 | MIN | 53 | 0.34 | 0.46 | -0.25 | 0.55 | - | -0.81 | - | -1.52 | |
| 2021-22 | MIN | 73 | -0.69 | -0.52 | -0.63 | -0.23 | - | 0.61 | -0.02 | -0.16 | |
| 2022-23 | MIN | 60 | -0.89 | -0.81 | -0.67 | -0.43 | - | -0.89 | 0.14 | 0.95 | |
| 2023-24 | MIN | 62 | 0.84 | 0.82 | 0.23 | -0.01 | - | -1.10 | -0.25 | 1.37 | |
| 2024-25 | MIN | 50 | 0.38 | 0.48 | -0.10 | 1.37 | - | 0.95 | -0.56 | -0.67 | |
| 2025-26 | MIN | 62 | -0.04 | -0.02 | -0.20 | 0.74 | - | -0.70 | -0.65 | 1.09 |
Situational and Secondary Archetypes
| Season | Team(s) | GP | TOI | 5v5 TOI | 5v4 TOI | 4v5 TOI | Possession | Drive | Suppress | Faceoffs |
|---|---|---|---|---|---|---|---|---|---|---|
| 2015-16 | MIN | 68 | 0.80 | -1.46 | 0.57 | -1.07 | -1.80 | 0.38 | - | |
| 2016-17 | MIN | 68 | -0.47 | -0.07 | 0.17 | 0.45 | -0.30 | 0.99 | - | |
| 2017-18 | MIN | 73 | 0.87 | -0.77 | 0.33 | -0.04 | -0.08 | 0.04 | - | |
| 2018-19 | MIN | 82 | 0.65 | -1.52 | 0.28 | 0.52 | -0.56 | 1.36 | - | |
| 2019-20 | MIN | 69 | 1.09 | -1.40 | 0.40 | 0.63 | -0.73 | 1.73 | - | |
| 2020-21 | MIN | 53 | 1.05 | -0.84 | 0.35 | 0.39 | -0.62 | 1.21 | - | |
| 2021-22 | MIN | 73 | 0.94 | -0.10 | 0.59 | 0.51 | 0.45 | 0.32 | - | |
| 2022-23 | MIN | 60 | 1.12 | -0.99 | 0.97 | 1.04 | 0.72 | 0.87 | - | |
| 2023-24 | MIN | 62 | 1.54 | -0.99 | 1.18 | 0.78 | 0.19 | 0.92 | - | |
| 2024-25 | MIN | 50 | 1.74 | -1.34 | 0.50 | 1.07 | -0.14 | 1.98 | - | |
| 2025-26 | MIN | 62 | 0.60 | -1.45 | 0.72 | 0.70 | 0.33 | 0.85 | - |
5v5 Individual Stats
| Season | Team(s) | GP | TOI | G/60 | A/60 | Pts/60 | xG/60 | GAE/60 | Sh% | xSh% | Sh%AE | %SA Rush | %SA Reb. |
|---|---|---|---|---|---|---|---|---|---|---|---|---|---|
| 2015-16 | MIN | 68 | 1156:36 | 0.10 | 0.21 | 0.31 | 0.10 | 0.00 | 4.08 | 3.98 | 0.10 | 0.00 | 1.25 |
| 2016-17 | MIN | 68 | 1027:38 | 0.00 | 0.93 | 0.93 | 0.13 | -0.13 | 0.00 | 3.77 | -3.77 | 0.00 | 5.56 |
| 2017-18 | MIN | 73 | 1244:42 | 0.29 | 0.48 | 0.77 | 0.10 | 0.19 | 10.00 | 3.30 | 6.70 | 2.30 | 3.45 |
| 2018-19 | MIN | 82 | 1395:17 | 0.13 | 0.52 | 0.64 | 0.14 | -0.01 | 3.00 | 3.27 | -0.27 | 0.00 | 1.59 |
| 2019-20 | MIN | 69 | 1201:01 | 0.10 | 0.95 | 1.05 | 0.16 | -0.06 | 2.27 | 3.64 | -1.37 | 1.65 | 4.13 |
| 2020-21 | MIN | 53 | 957:17 | 0.19 | 0.75 | 0.94 | 0.14 | 0.05 | 4.55 | 3.36 | 1.18 | 0.00 | 1.18 |
| 2021-22 | MIN | 73 | 1280:38 | 0.14 | 0.56 | 0.70 | 0.18 | -0.04 | 2.97 | 3.75 | -0.78 | 1.59 | 2.38 |
| 2022-23 | MIN | 60 | 1061:47 | 0.11 | 0.45 | 0.57 | 0.17 | -0.06 | 2.53 | 3.80 | -1.26 | 0.00 | 1.80 |
| 2023-24 | MIN | 62 | 1143:13 | 0.26 | 0.89 | 1.15 | 0.24 | 0.02 | 5.10 | 4.75 | 0.35 | 0.00 | 5.80 |
| 2024-25 | MIN | 50 | 1001:49 | 0.24 | 0.72 | 0.96 | 0.11 | 0.13 | 5.88 | 2.80 | 3.09 | 1.05 | 1.05 |
| 2025-26 | MIN | 62 | 1082:12 | 0.22 | 0.72 | 0.94 | 0.12 | 0.10 | 5.63 | 3.11 | 2.52 | 0.00 | 5.15 |
5v5 On Ice Stats
| Season | Team(s) | GP | TOI | SAF/60 | GF/60 | xGF/60 | SAA/60 | GA/60 | xGA/60 | GF% | xGF% | xGF Rel | xGA Rel | xGF% Rel |
|---|---|---|---|---|---|---|---|---|---|---|---|---|---|---|
| 2015-16 | MIN | 68 | 1156:36 | 33.36 | 1.45 | 1.78 | 39.48 | 1.61 | 1.97 | 47.46 | 47.36 | -0.34 | -0.02 | -4.19 |
| 2016-17 | MIN | 68 | 1027:38 | 39.94 | 2.57 | 2.17 | 38.54 | 2.10 | 1.74 | 55.00 | 55.48 | -0.24 | -0.27 | 0.93 |
| 2017-18 | MIN | 73 | 1244:42 | 38.76 | 3.04 | 2.21 | 42.66 | 2.27 | 2.15 | 57.27 | 50.69 | 0.06 | 0.12 | -0.67 |
| 2018-19 | MIN | 82 | 1395:17 | 41.76 | 1.81 | 2.24 | 37.50 | 2.19 | 1.94 | 45.16 | 53.59 | -0.28 | -0.24 | -0.03 |
| 2019-20 | MIN | 69 | 1201:01 | 39.57 | 2.65 | 2.26 | 38.12 | 2.30 | 1.89 | 53.54 | 54.44 | -0.11 | -0.28 | 2.20 |
| 2020-21 | MIN | 53 | 957:17 | 36.42 | 2.51 | 2.10 | 39.17 | 2.70 | 2.13 | 48.19 | 49.59 | -0.27 | -0.05 | -2.42 |
| 2021-22 | MIN | 73 | 1280:38 | 43.38 | 2.53 | 2.58 | 39.54 | 2.20 | 2.06 | 53.47 | 55.59 | 0.08 | -0.21 | 3.14 |
| 2022-23 | MIN | 60 | 1061:47 | 42.72 | 2.32 | 2.51 | 39.73 | 1.70 | 2.44 | 57.75 | 50.63 | 0.20 | 0.02 | 1.89 |
| 2023-24 | MIN | 62 | 1143:13 | 40.99 | 2.73 | 2.43 | 38.63 | 1.94 | 2.07 | 58.43 | 53.98 | 0.18 | -0.20 | 4.27 |
| 2024-25 | MIN | 50 | 1001:49 | 38.75 | 2.40 | 2.10 | 37.91 | 2.34 | 2.11 | 50.63 | 49.94 | -0.08 | -0.27 | 2.11 |
| 2025-26 | MIN | 62 | 1082:12 | 42.03 | 2.61 | 2.40 | 40.64 | 1.77 | 2.34 | 59.49 | 50.69 | -0.26 | -0.36 | 0.96 |
NHL Edge Stats
| Skating | Shooting | Zone Time | |||||||||||
|---|---|---|---|---|---|---|---|---|---|---|---|---|---|
| Season | GP | Top Speed | Bursts>20/mi | Avg. Speed | Top Speed | Avg. Speed | %Long Range | %Mid Range | %High Danger | ES DZ% | ES NZ% | ES OZ% | |
| This table is for Basic and Premium subscribers only. To view please login to and/or subscribe to one of our subscription plans. | |||||||||||||
Legend
| Percentile 0-25 | Percentile 25-50 | Percentile 50-75 | Percentile 75-100 |
5v5 Defense Pairs
| Season | Teammate | Team | TOI | GF/60 | GA/60 | GF% | xGF/60 | xGA/60 | xGF% | xGF Rel | xGA Rel | xGF% Rel |
|---|
Glossary
| Type | Statistic | Definition |
|---|---|---|
| Individual | G/60 | Goals Against per 60 minutes. |
| Individual | A/60 | Assists per 60 minutes. |
| Individual | Pts/60 | Points per 60 minutes. |
| Individual | xG/60 | Expected Goals per 60 minutes. |
| Individual | GAE/60 | Goals Above Expected (G/60 - xG/60). |
| Individual | Sh% | Shooting Percentage. |
| Individual | xSh% | Expected Shooting Percentage. |
| Individual | Sh%AE | Shooting percentage above expected (Sh% - xSh%). |
| Individual | %SA Rush | Percentage of shot attempts determined to be on the rush. |
| Individual | %SA Reb. | Percentage of shot attempts determined to be from rebounds. |
| On Ice | SAF/60 | Shot Attempts For per 60 minutes. |
| On Ice | GF/60 | Goals For per 60 minutes. |
| On Ice | xGF/60 | Expected Goals For per 60 minutes. |
| On Ice | SAA/60 | Shot Attempts Against per 60 minutes (lower is better). |
| On Ice | GA/60 | Goals Against per 60 minutes (lower is better). |
| On Ice | xGA/60 | Expected Goals Against per 60 minutes (lower is better). |
| On Ice | GF% | Goals For Percentage = Goals For / (Goals For + Goals Against) |
| On Ice | xGF% | Expected Goals For Percentage = Expected Goals For / (Expected Goals For + Expected Goals Against) |
| On Ice | xGF Rel | xGF/60 when On Ice - xGF/60 when not On Ice. |
| On Ice | xGA Rel | xGA/60 when On Ice - xGA/60 when not On Ice (lower is better). |
| On Ice | xGF% Rel | xGF% when On Ice - xGF% when not On Ice. |
News and Opinions
-
Wild 2025-26 Report Cards: Jonas Brodin at The Hockey Writers (Thu Jun 25, 2026)
-
Top 3 Defensive Targets for the Senators This Offseason at The Hockey Writers (Tue Jun 9, 2026)
-
Can the Wild Actually Withstand Losing Jonas Brodin? at Hockey Wilderness (Fri May 29, 2026)
-
Will the Wild Pass the Torch On the Blue Line This Summer? at Hockey Wilderness (Tue May 26, 2026)
-
Wild vets Brodin, Eriksson Ek each had broken foot that kept them out of playoff series loss to Avs at Yahoo Sports NHL (Sat May 16, 2026)
-
Wild vets Brodin, Eriksson Ek each had broken foot that kept them out of playoff series loss to Avs at NBC Sports (Sat May 16, 2026)
-
Wild vets Brodin, Eriksson Ek each had broken foot that kept them out of playoff series loss to Avs at Yahoo Sports NHL (Fri May 15, 2026)
-
5 Wild who just played their final game for Minnesota at Gone Puck Wild (Fri May 15, 2026)
-
Wild get less than ideal news about Joel Eriksson Ek ahead of Game 4 vs. Colorado at Gone Puck Wild (Mon May 11, 2026)
-
The Wild Lost Their Identity Without Brodin and Eriksson Ek at Hockey Wilderness (Fri May 8, 2026)
-
The Wild Can’t Keep Rolling With Spurgeon and Middleton at Hockey Wilderness (Thu May 7, 2026)
-
Wild get a nightmare Joel Eriksson Ek and Jonas Brodin injury update at exactly the wrong time at Gone Puck Wild (Thu May 7, 2026)
-
The Wild Are Really Feeling Jonas Brodin's Absence at Hockey Wilderness (Wed May 6, 2026)
-
The Wild Will Miss Brodin More the Longer He's Out Against the Avs at Hockey Wilderness (Sun May 3, 2026)
-
Wild’s Jonas Brodin Exits Game 5 With Lower-Body Injury at Yahoo Sports NHL (Tue Apr 28, 2026)
-
Jonas Brodin Is the Glue Holding the Wild Defense Together at Hockey Wilderness (Thu Dec 4, 2025)
-
2011 NHL Draft Top 10: Where Are They Now? at The Hockey Writers (Tue Sep 16, 2025)
-
Bold Predictions for the Wild’s 2025-26 Season at The Hockey Writers (Fri Aug 29, 2025)
-
Wild 2024-25 Report Cards: Jonas Brodin & Brock Faber at The Hockey Writers (Thu Aug 14, 2025)
Current Contract
Jonas Brodin signed a $42,000,000 7-year contract with the Minnesota Wild and General Manager Bill Guerin on September 15, 2020 with an AAV of $6,000,000. This contract will start in 2021-22 and end after the 2027-28 season. In the first season of the contract the cap hit was equivalent to 7.36% of the salary cap.
Standard Contract (UFA) ( ) (0 ratings)
Jonas Brodin signed a $25,000,000 6-year contract with the Minnesota Wild and General Manager Chuck Fletcher on October 13, 2014 with an AAV of $4,166,667. This contract will start in 2015-16 and end after the 2020-21 season. In the first season of the contract the cap hit was equivalent to 5.84% of the salary cap.
Standard Contract (RFA) ( ) (0 ratings)
| Season | Age* | Clause | Cap Hit | AAV | Perf. Bonus | Sign. Bonus | Salary | Compensation | Minors Salary | Status | |
|---|---|---|---|---|---|---|---|---|---|---|---|
| 2015-16 | 22 | $4,166,667 | $4,166,667 | - | - | $2,500,000 | $2,500,000 | $2,500,000 | RFA | ||
| 2016-17 | 23 | $4,166,667 | $4,166,667 | - | - | $4,000,000 | $4,000,000 | $4,000,000 | RFA-arb | ||
| 2017-18 | 24 | $4,166,667 | $4,166,667 | - | - | $4,500,000 | $4,500,000 | $4,500,000 | RFA-arb | ||
| 2018-19 | 25 | $4,166,667 | $4,166,667 | - | - | $5,750,000 | $5,750,000 | $5,750,000 | RFA-arb | ||
| 2019-20 | 26 | $4,166,667 | $4,166,667 | - | - | $4,750,000 | $4,750,000 | $4,750,000 | UFA | ||
| 2020-21 | 27 | NMC | $4,166,667 | $4,166,667 | - | - | $3,500,000 | $3,500,000 | $3,500,000 | UFA | |
| Total | - | - | $25,000,000 | $25,000,000 | $25,000,000 |
Jonas Brodin signed a $2,775,000 3-year contract with the Minnesota Wild and General Manager Chuck Fletcher on July 13, 2011 with an AAV of $925,000. This contract will start in 2011-12 and end after the 2014-15 season. In the first season of the contract the cap hit was equivalent to 1.44% of the salary cap.
Entry Level Contract ( ) (0 ratings)
| Season | Age* | Clause | Cap Hit | AAV | Perf. Bonus | Sign. Bonus | Salary | Compensation | Minors Salary | Status | |
|---|---|---|---|---|---|---|---|---|---|---|---|
| 2011-12 | 18 | $925,000 | $1,475,000 | - | $92,500 | - | $92,500 | - | ELC | ||
| 2012-13 | 19 | $894,167 | $1,444,167 | $500,000 | $92,500 | $832,500 | $925,000 | $70,000 | ELC | ||
| 2013-14 | 20 | $894,167 | $1,444,167 | $550,000 | $92,500 | $832,500 | $925,000 | $70,000 | ELC | ||
| 2014-15 | 21 | $894,167 | $1,444,167 | $600,000 | - | $832,500 | $832,500 | $70,000 | ELC | ||
| Total | $1,650,000 | $277,500 | $2,497,500 | $2,775,000 | $210,000 |
Career Statistics
| Regular Season | Playoffs | |||||||||||||||||||
|---|---|---|---|---|---|---|---|---|---|---|---|---|---|---|---|---|---|---|---|---|
| Season | League | Team | GP | G | A | Pts | +/- | PIM | Shots | Sh% | TOI/G | GP | G | A | Pts | +/- | PIM | Shots | Sh% | TOI/G |
| 2008-09 | Swe-U18 | Farjestad U18 | 22 | 3 | 8 | 11 | 10 | 4 | 1 | 1 | 2 | 4 | ||||||||
| 2009-10 | Sweden-3 | Skare | 21 | 1 | 6 | 7 | 10 | |||||||||||||
| 2009-10 | Sweden | Farjestad | 3 | 0 | 0 | 0 | 2 | |||||||||||||
| 2009-10 | Swe-Jr. | Skare Jr. | 2 | 0 | 1 | 1 | 2 | |||||||||||||
| 2009-10 | Swe-U18 | Farjestad U18 | 19 | 6 | 11 | 17 | 6 | 7 | 3 | 8 | 11 | 8 | ||||||||
| 2010-11 | WJ18-A | Sweden | 4 | 0 | 1 | 1 | +3 | 2 | ||||||||||||
| 2010-11 | Swe-U18 | Farjestad U18 | 2 | 0 | 1 | 1 | 2 | |||||||||||||
| 2010-11 | Sweden | Farjestad | 42 | 0 | 4 | 4 | 12 | 14 | 2 | 2 | 2 | |||||||||
| 2011-12 | WJC-A | Sweden | 6 | 0 | 4 | 4 | +2 | 14 | ||||||||||||
| 2011-12 | Swe-Jr. | Farjestad Jr. | 1 | 0 | 0 | 0 | ||||||||||||||
| 2011-12 | Sweden | Farjestad | 49 | 0 | 8 | 8 | 14 | 11 | 2 | 2 | 6 | |||||||||
| 2012-13 | AHL | Houston | 9 | 2 | 2 | 4 | +2 | 4 | 13 | 1,538.0 | ||||||||||
| 2012-13 | NHL | Minnesota Wild | 45 | 2 | 9 | 11 | +3 | 10 | 51 | 3.9 | 23:13 | 5 | -3 | 3 | 0.0 | 26:23 | ||||
| 2013-14 | NHL | Minnesota Wild | 79 | 8 | 11 | 19 | 22 | 74 | 10.8 | 23:54 | 13 | 2 | 2 | +3 | 12 | 11 | 0.0 | 23:38 | ||
| 2014-15 | NHL | Minnesota Wild | 71 | 3 | 14 | 17 | +21 | 8 | 95 | 3.2 | 24:10 | 10 | -2 | 3 | 0.0 | 21:53 | ||||
| 2015-16 | NHL | Minnesota Wild | 68 | 2 | 5 | 7 | -5 | 20 | 58 | 3.4 | 20:25 | 6 | 1 | 2 | 3 | +3 | 1 | 100.0 | 20:36 | |
| 2016-17 | WC | Sweden | 10 | 1 | 2 | 3 | +6 | 6 | ||||||||||||
| 2016-17 | EHT | Sweden | 2 | 0 | 0 | 0 | -1 | |||||||||||||
| 2016-17 | NHL | Minnesota Wild | 68 | 3 | 22 | 25 | +5 | 20 | 85 | 3.5 | 19:34 | 5 | 1 | 1 | -3 | 5 | 0.0 | 19:01 | ||
| 2017-18 | NHL | Minnesota Wild | 73 | 6 | 15 | 21 | +23 | 30 | 77 | 7.8 | 21:36 | 5 | 2 | 2 | -3 | 2 | 9 | 0.0 | 24:42 | |
| 2018-19 | NHL | Minnesota Wild | 82 | 4 | 14 | 18 | -15 | 30 | 111 | 3.6 | 20:33 | |||||||||
| 2019-20 | NHL | Minnesota Wild | 69 | 2 | 26 | 28 | +15 | 24 | 103 | 1.9 | 21:33 | 4 | 2 | 2 | +1 | 8 | 0.0 | 23:48 | ||
| 2020-21 | NHL | Minnesota Wild | 53 | 9 | 14 | 23 | +2 | 18 | 79 | 11.4 | 22:26 | 7 | 3 | 3 | 2 | 5 | 0.0 | 19:43 | ||
| 2021-22 | NHL | Minnesota Wild | 73 | 5 | 25 | 30 | +9 | 18 | 126 | 4.0 | 23:26 | 6 | 1 | 2 | 3 | -2 | 2 | 11 | 9.1 | 22:55 |
| 2022-23 | NHL | Minnesota Wild | 60 | 3 | 11 | 14 | +13 | 30 | 90 | 3.3 | 22:52 | 6 | +1 | 9 | 0.0 | 25:47 | ||||
| 2023-24 | NHL | Minnesota Wild | 62 | 7 | 20 | 27 | +22 | 16 | 117 | 6.0 | 23:22 | |||||||||
| 2024-25 | WC | Sweden | 10 | 3 | 4 | 7 | +12 | 2 | ||||||||||||
| 2024-25 | 4 Nations | Sweden | 3 | 1 | 0 | 1 | -1 | 1 | 100.0 | 17:06 | ||||||||||
| 2024-25 | NHL | Minnesota Wild | 50 | 4 | 16 | 20 | +10 | 18 | 71 | 5.6 | 22:57 | 6 | 1 | 1 | -1 | 4 | 0.0 | 24:48 | ||
| 2025-26 | NHL | Minnesota Wild | 62 | 4 | 14 | 18 | +19 | 16 | 76 | 5.3 | 20:17 | 5 | 1 | 1 | +2 | 4 | 6 | 0.0 | 19:41 | |
| NHL Career | 915 | 62 | 216 | 278 | +122 | 280 | 1213 | 5.1 | 22:07 | 78 | 2 | 16 | 18 | -4 | 22 | 75 | 2.7 | 22:44 | ||